Immigrants from Northern Europe vs Immigrants from Grenada 1 or more Vehicles in Household
COMPARE
Immigrants from Northern Europe
Immigrants from Grenada
1 or more Vehicles in Household
1 or more Vehicles in Household Comparison
Immigrants from Northern Europe
Immigrants from Grenada
89.5%
1 OR MORE VEHICLES IN HOUSEHOLD
35.5/ 100
METRIC RATING
193rd/ 347
METRIC RANK
62.7%
1 OR MORE VEHICLES IN HOUSEHOLD
0.0/ 100
METRIC RATING
346th/ 347
METRIC RANK
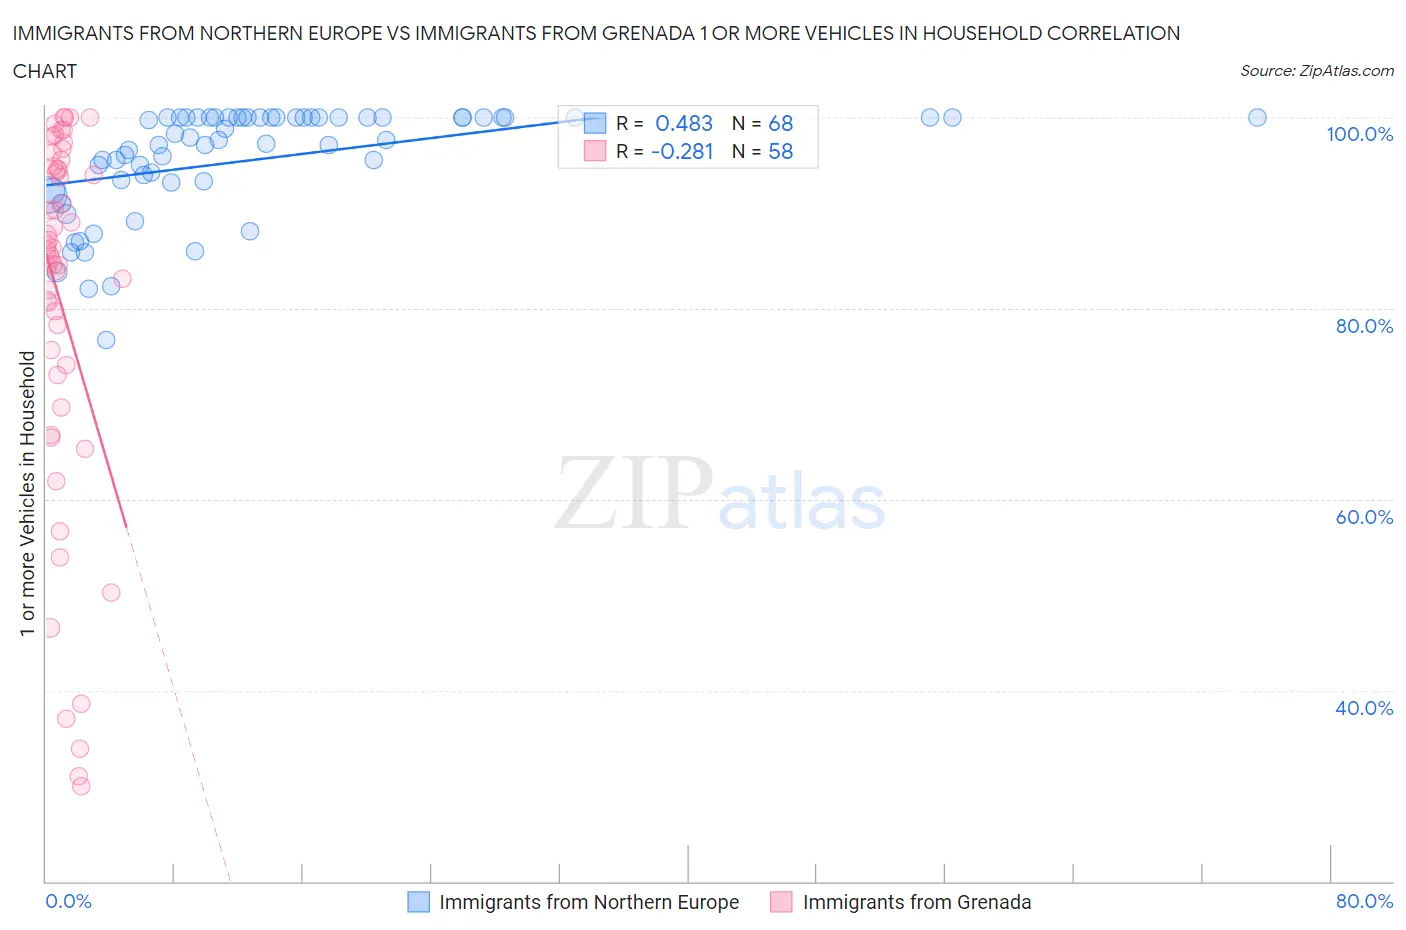
Immigrants from Northern Europe vs Immigrants from Grenada 1 or more Vehicles in Household Correlation Chart
The statistical analysis conducted on geographies consisting of 476,984,908 people shows a moderate positive correlation between the proportion of Immigrants from Northern Europe and percentage of households with 1 or more vehicles available in the United States with a correlation coefficient (R) of 0.483 and weighted average of 89.5%. Similarly, the statistical analysis conducted on geographies consisting of 67,200,374 people shows a weak negative correlation between the proportion of Immigrants from Grenada and percentage of households with 1 or more vehicles available in the United States with a correlation coefficient (R) of -0.281 and weighted average of 62.7%, a difference of 42.8%.
1 or more Vehicles in Household Correlation Summary
| Measurement | Immigrants from Northern Europe | Immigrants from Grenada |
| Minimum | 76.7% | 30.0% |
| Maximum | 100.0% | 100.0% |
| Range | 23.3% | 70.0% |
| Mean | 95.6% | 80.2% |
| Median | 97.7% | 85.9% |
| Interquartile 25% (IQ1) | 93.2% | 73.0% |
| Interquartile 75% (IQ3) | 100.0% | 94.7% |
| Interquartile Range (IQR) | 6.8% | 21.6% |
| Standard Deviation (Sample) | 5.7% | 19.4% |
| Standard Deviation (Population) | 5.6% | 19.2% |
Similar Demographics by 1 or more Vehicles in Household
Demographics Similar to Immigrants from Northern Europe by 1 or more Vehicles in Household
In terms of 1 or more vehicles in household, the demographic groups most similar to Immigrants from Northern Europe are Immigrants from North Macedonia (89.5%, a difference of 0.020%), Shoshone (89.5%, a difference of 0.030%), Immigrants from Poland (89.5%, a difference of 0.030%), Carpatho Rusyn (89.5%, a difference of 0.040%), and Immigrants from Eritrea (89.4%, a difference of 0.040%).
| Demographics | Rating | Rank | 1 or more Vehicles in Household |
| Pueblo | 39.9 /100 | #186 | Fair 89.6% |
| South Americans | 39.6 /100 | #187 | Fair 89.5% |
| Immigrants | Nepal | 38.9 /100 | #188 | Fair 89.5% |
| Carpatho Rusyns | 37.8 /100 | #189 | Fair 89.5% |
| Shoshone | 37.5 /100 | #190 | Fair 89.5% |
| Immigrants | Poland | 37.1 /100 | #191 | Fair 89.5% |
| Immigrants | North Macedonia | 36.5 /100 | #192 | Fair 89.5% |
| Immigrants | Northern Europe | 35.5 /100 | #193 | Fair 89.5% |
| Immigrants | Eritrea | 33.2 /100 | #194 | Fair 89.4% |
| Immigrants | Armenia | 31.8 /100 | #195 | Fair 89.4% |
| Crow | 24.3 /100 | #196 | Fair 89.3% |
| Immigrants | Sweden | 23.6 /100 | #197 | Fair 89.3% |
| Pennsylvania Germans | 22.9 /100 | #198 | Fair 89.3% |
| Immigrants | Asia | 22.8 /100 | #199 | Fair 89.3% |
| Central Americans | 21.4 /100 | #200 | Fair 89.2% |
Demographics Similar to Immigrants from Grenada by 1 or more Vehicles in Household
In terms of 1 or more vehicles in household, the demographic groups most similar to Immigrants from Grenada are Immigrants from St. Vincent and the Grenadines (64.7%, a difference of 3.2%), Yup'ik (58.4%, a difference of 7.2%), Immigrants from Dominican Republic (68.6%, a difference of 9.5%), British West Indian (70.4%, a difference of 12.2%), and Immigrants from Guyana (70.6%, a difference of 12.6%).
| Demographics | Rating | Rank | 1 or more Vehicles in Household |
| Immigrants | Ecuador | 0.0 /100 | #333 | Tragic 76.2% |
| Immigrants | Bangladesh | 0.0 /100 | #334 | Tragic 74.3% |
| Barbadians | 0.0 /100 | #335 | Tragic 74.0% |
| Vietnamese | 0.0 /100 | #336 | Tragic 73.8% |
| Immigrants | Uzbekistan | 0.0 /100 | #337 | Tragic 73.4% |
| Inupiat | 0.0 /100 | #338 | Tragic 71.5% |
| Guyanese | 0.0 /100 | #339 | Tragic 70.8% |
| Dominicans | 0.0 /100 | #340 | Tragic 70.7% |
| Immigrants | Barbados | 0.0 /100 | #341 | Tragic 70.6% |
| Immigrants | Guyana | 0.0 /100 | #342 | Tragic 70.6% |
| British West Indians | 0.0 /100 | #343 | Tragic 70.4% |
| Immigrants | Dominican Republic | 0.0 /100 | #344 | Tragic 68.6% |
| Immigrants | St. Vincent and the Grenadines | 0.0 /100 | #345 | Tragic 64.7% |
| Immigrants | Grenada | 0.0 /100 | #346 | Tragic 62.7% |
| Yup'ik | 0.0 /100 | #347 | Tragic 58.4% |