Sri Lankan vs Austrian Unemployment
COMPARE
Sri Lankan
Austrian
Unemployment
Unemployment Comparison
Sri Lankans
Austrians
5.2%
UNEMPLOYMENT
69.5/ 100
METRIC RATING
157th/ 347
METRIC RANK
4.8%
UNEMPLOYMENT
99.5/ 100
METRIC RATING
44th/ 347
METRIC RANK
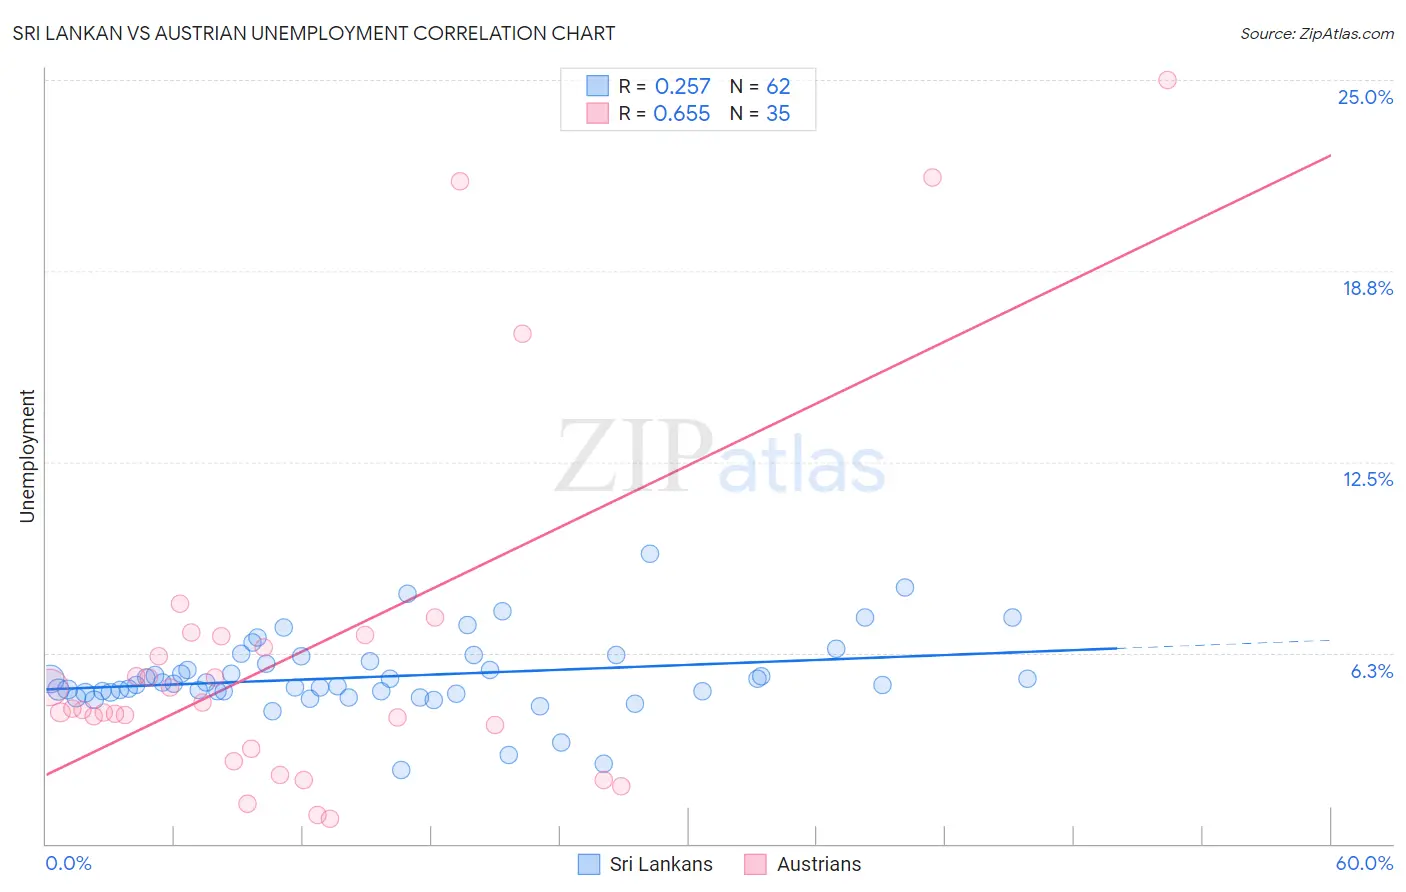
Sri Lankan vs Austrian Unemployment Correlation Chart
The statistical analysis conducted on geographies consisting of 440,052,205 people shows a weak positive correlation between the proportion of Sri Lankans and unemployment in the United States with a correlation coefficient (R) of 0.257 and weighted average of 5.2%. Similarly, the statistical analysis conducted on geographies consisting of 451,169,494 people shows a significant positive correlation between the proportion of Austrians and unemployment in the United States with a correlation coefficient (R) of 0.655 and weighted average of 4.8%, a difference of 7.4%.
Unemployment Correlation Summary
| Measurement | Sri Lankan | Austrian |
| Minimum | 2.4% | 0.80% |
| Maximum | 9.5% | 25.0% |
| Range | 7.1% | 24.2% |
| Mean | 5.5% | 6.3% |
| Median | 5.2% | 4.4% |
| Interquartile 25% (IQ1) | 5.0% | 3.1% |
| Interquartile 75% (IQ3) | 6.0% | 6.8% |
| Interquartile Range (IQR) | 1.0% | 3.7% |
| Standard Deviation (Sample) | 1.2% | 5.9% |
| Standard Deviation (Population) | 1.2% | 5.8% |
Similar Demographics by Unemployment
Demographics Similar to Sri Lankans by Unemployment
In terms of unemployment, the demographic groups most similar to Sri Lankans are Immigrants from Kazakhstan (5.2%, a difference of 0.060%), Immigrants from Northern Africa (5.2%, a difference of 0.13%), Immigrants from Egypt (5.2%, a difference of 0.20%), Immigrants from Russia (5.2%, a difference of 0.20%), and Laotian (5.2%, a difference of 0.23%).
| Demographics | Rating | Rank | Unemployment |
| Potawatomi | 76.2 /100 | #150 | Good 5.2% |
| Immigrants | Eastern Europe | 75.3 /100 | #151 | Good 5.2% |
| Immigrants | Hong Kong | 75.2 /100 | #152 | Good 5.2% |
| Egyptians | 75.2 /100 | #153 | Good 5.2% |
| Immigrants | China | 74.7 /100 | #154 | Good 5.2% |
| Immigrants | Northern Africa | 71.3 /100 | #155 | Good 5.2% |
| Immigrants | Kazakhstan | 70.4 /100 | #156 | Good 5.2% |
| Sri Lankans | 69.5 /100 | #157 | Good 5.2% |
| Immigrants | Egypt | 66.7 /100 | #158 | Good 5.2% |
| Immigrants | Russia | 66.6 /100 | #159 | Good 5.2% |
| Laotians | 66.3 /100 | #160 | Good 5.2% |
| Immigrants | Oceania | 65.2 /100 | #161 | Good 5.2% |
| Spanish | 65.1 /100 | #162 | Good 5.2% |
| Immigrants | Zaire | 64.7 /100 | #163 | Good 5.2% |
| Immigrants | Colombia | 64.7 /100 | #164 | Good 5.2% |
Demographics Similar to Austrians by Unemployment
In terms of unemployment, the demographic groups most similar to Austrians are French (4.8%, a difference of 0.050%), Yugoslavian (4.8%, a difference of 0.060%), Immigrants from Nepal (4.8%, a difference of 0.22%), Immigrants from Taiwan (4.8%, a difference of 0.24%), and Filipino (4.8%, a difference of 0.26%).
| Demographics | Rating | Rank | Unemployment |
| Czechoslovakians | 99.7 /100 | #37 | Exceptional 4.8% |
| Bolivians | 99.7 /100 | #38 | Exceptional 4.8% |
| Lithuanians | 99.7 /100 | #39 | Exceptional 4.8% |
| Northern Europeans | 99.7 /100 | #40 | Exceptional 4.8% |
| Immigrants | Bosnia and Herzegovina | 99.7 /100 | #41 | Exceptional 4.8% |
| Filipinos | 99.5 /100 | #42 | Exceptional 4.8% |
| Yugoslavians | 99.5 /100 | #43 | Exceptional 4.8% |
| Austrians | 99.5 /100 | #44 | Exceptional 4.8% |
| French | 99.5 /100 | #45 | Exceptional 4.8% |
| Immigrants | Nepal | 99.4 /100 | #46 | Exceptional 4.8% |
| Immigrants | Taiwan | 99.4 /100 | #47 | Exceptional 4.8% |
| Immigrants | Scotland | 99.3 /100 | #48 | Exceptional 4.9% |
| Immigrants | South Central Asia | 99.3 /100 | #49 | Exceptional 4.9% |
| French Canadians | 99.3 /100 | #50 | Exceptional 4.9% |
| Immigrants | Belgium | 99.2 /100 | #51 | Exceptional 4.9% |