Spanish vs Lebanese No Vehicles in Household
COMPARE
Spanish
Lebanese
No Vehicles in Household
No Vehicles in Household Comparison
Spanish
Lebanese
7.9%
NO VEHICLES IN HOUSEHOLD
99.9/ 100
METRIC RATING
46th/ 347
METRIC RANK
8.7%
NO VEHICLES IN HOUSEHOLD
99.3/ 100
METRIC RATING
85th/ 347
METRIC RANK
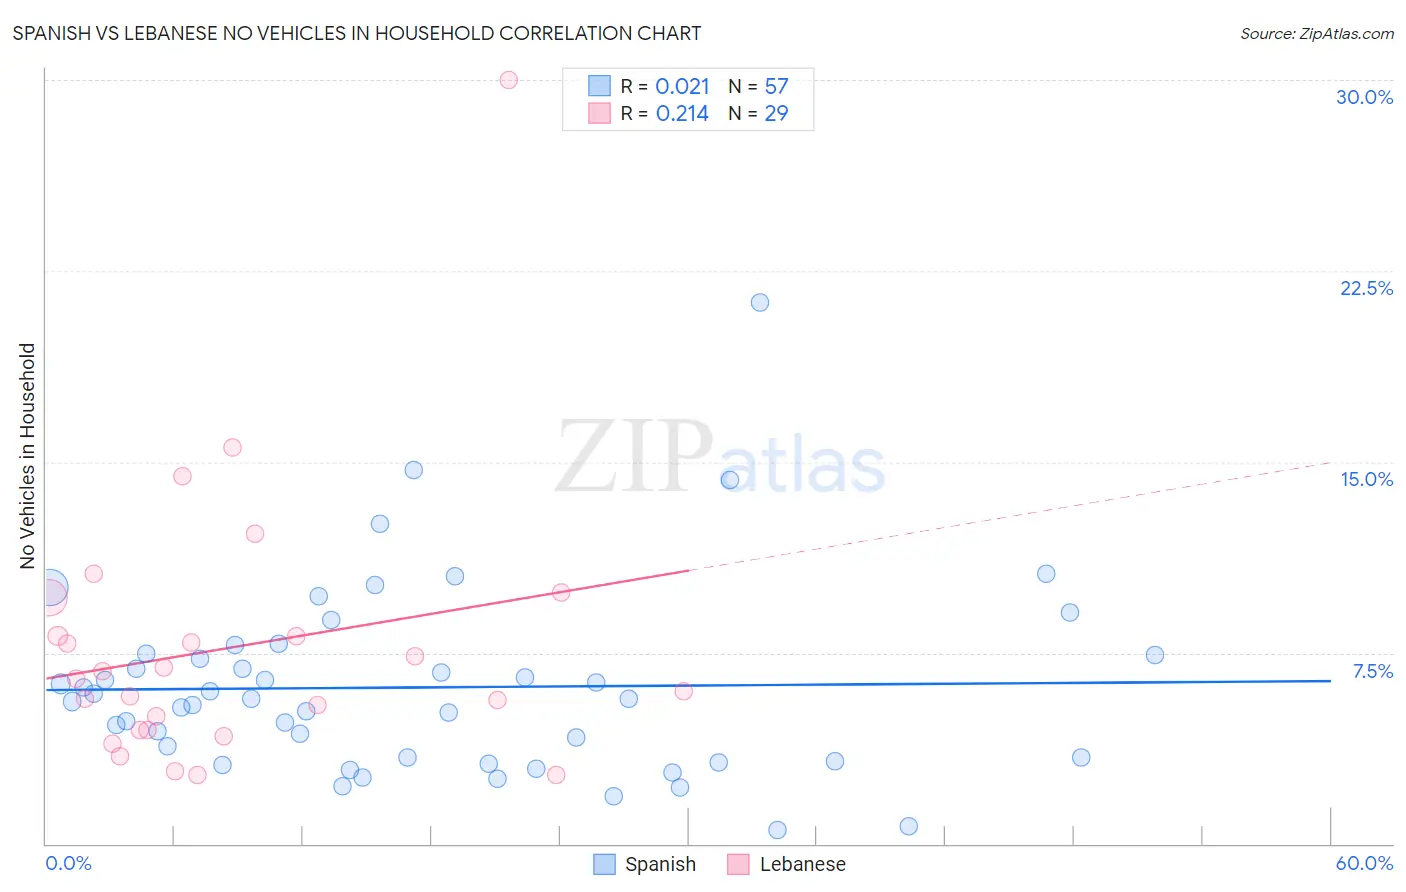
Spanish vs Lebanese No Vehicles in Household Correlation Chart
The statistical analysis conducted on geographies consisting of 420,840,266 people shows no correlation between the proportion of Spanish and percentage of households with no vehicle available in the United States with a correlation coefficient (R) of 0.021 and weighted average of 7.9%. Similarly, the statistical analysis conducted on geographies consisting of 400,489,839 people shows a weak positive correlation between the proportion of Lebanese and percentage of households with no vehicle available in the United States with a correlation coefficient (R) of 0.214 and weighted average of 8.7%, a difference of 9.3%.
No Vehicles in Household Correlation Summary
| Measurement | Spanish | Lebanese |
| Minimum | 0.56% | 2.7% |
| Maximum | 21.2% | 30.0% |
| Range | 20.7% | 27.3% |
| Mean | 6.1% | 7.7% |
| Median | 5.7% | 6.5% |
| Interquartile 25% (IQ1) | 3.3% | 4.4% |
| Interquartile 75% (IQ3) | 7.4% | 8.9% |
| Interquartile Range (IQR) | 4.1% | 4.5% |
| Standard Deviation (Sample) | 3.7% | 5.4% |
| Standard Deviation (Population) | 3.7% | 5.3% |
Similar Demographics by No Vehicles in Household
Demographics Similar to Spanish by No Vehicles in Household
In terms of no vehicles in household, the demographic groups most similar to Spanish are Northern European (7.9%, a difference of 0.12%), Nonimmigrants (7.9%, a difference of 0.26%), Choctaw (7.9%, a difference of 0.43%), Afghan (8.0%, a difference of 0.59%), and Guamanian/Chamorro (8.0%, a difference of 0.77%).
| Demographics | Rating | Rank | No Vehicles in Household |
| Immigrants | Fiji | 99.9 /100 | #39 | Exceptional 7.8% |
| Czechoslovakians | 99.9 /100 | #40 | Exceptional 7.8% |
| French Canadians | 99.9 /100 | #41 | Exceptional 7.8% |
| Swiss | 99.9 /100 | #42 | Exceptional 7.9% |
| Chickasaw | 99.9 /100 | #43 | Exceptional 7.9% |
| Choctaw | 99.9 /100 | #44 | Exceptional 7.9% |
| Immigrants | Nonimmigrants | 99.9 /100 | #45 | Exceptional 7.9% |
| Spanish | 99.9 /100 | #46 | Exceptional 7.9% |
| Northern Europeans | 99.9 /100 | #47 | Exceptional 7.9% |
| Afghans | 99.9 /100 | #48 | Exceptional 8.0% |
| Guamanians/Chamorros | 99.9 /100 | #49 | Exceptional 8.0% |
| Belgians | 99.9 /100 | #50 | Exceptional 8.0% |
| Koreans | 99.9 /100 | #51 | Exceptional 8.0% |
| Hawaiians | 99.9 /100 | #52 | Exceptional 8.0% |
| Slovenes | 99.9 /100 | #53 | Exceptional 8.0% |
Demographics Similar to Lebanese by No Vehicles in Household
In terms of no vehicles in household, the demographic groups most similar to Lebanese are Immigrants from Jordan (8.7%, a difference of 0.060%), Bangladeshi (8.7%, a difference of 0.11%), Italian (8.6%, a difference of 0.31%), Immigrants from England (8.7%, a difference of 0.33%), and Osage (8.7%, a difference of 0.45%).
| Demographics | Rating | Rank | No Vehicles in Household |
| Immigrants | South Central Asia | 99.5 /100 | #78 | Exceptional 8.6% |
| Portuguese | 99.5 /100 | #79 | Exceptional 8.6% |
| Bolivians | 99.4 /100 | #80 | Exceptional 8.6% |
| Tsimshian | 99.4 /100 | #81 | Exceptional 8.6% |
| Immigrants | South Eastern Asia | 99.4 /100 | #82 | Exceptional 8.6% |
| Italians | 99.4 /100 | #83 | Exceptional 8.6% |
| Immigrants | Jordan | 99.3 /100 | #84 | Exceptional 8.7% |
| Lebanese | 99.3 /100 | #85 | Exceptional 8.7% |
| Bangladeshis | 99.3 /100 | #86 | Exceptional 8.7% |
| Immigrants | England | 99.2 /100 | #87 | Exceptional 8.7% |
| Osage | 99.2 /100 | #88 | Exceptional 8.7% |
| Immigrants | Cuba | 99.2 /100 | #89 | Exceptional 8.7% |
| Bhutanese | 99.2 /100 | #90 | Exceptional 8.7% |
| Immigrants | Germany | 99.1 /100 | #91 | Exceptional 8.7% |
| Immigrants | Canada | 99.1 /100 | #92 | Exceptional 8.7% |