Soviet Union vs Northern European Unemployment Among Women with Children Under 6 years
COMPARE
Soviet Union
Northern European
Unemployment Among Women with Children Under 6 years
Unemployment Among Women with Children Under 6 years Comparison
Soviet Union
Northern Europeans
6.5%
UNEMPLOYMENT AMONG WOMEN WITH CHILDREN UNDER 6 YEARS
100.0/ 100
METRIC RATING
25th/ 347
METRIC RANK
7.5%
UNEMPLOYMENT AMONG WOMEN WITH CHILDREN UNDER 6 YEARS
74.3/ 100
METRIC RATING
154th/ 347
METRIC RANK
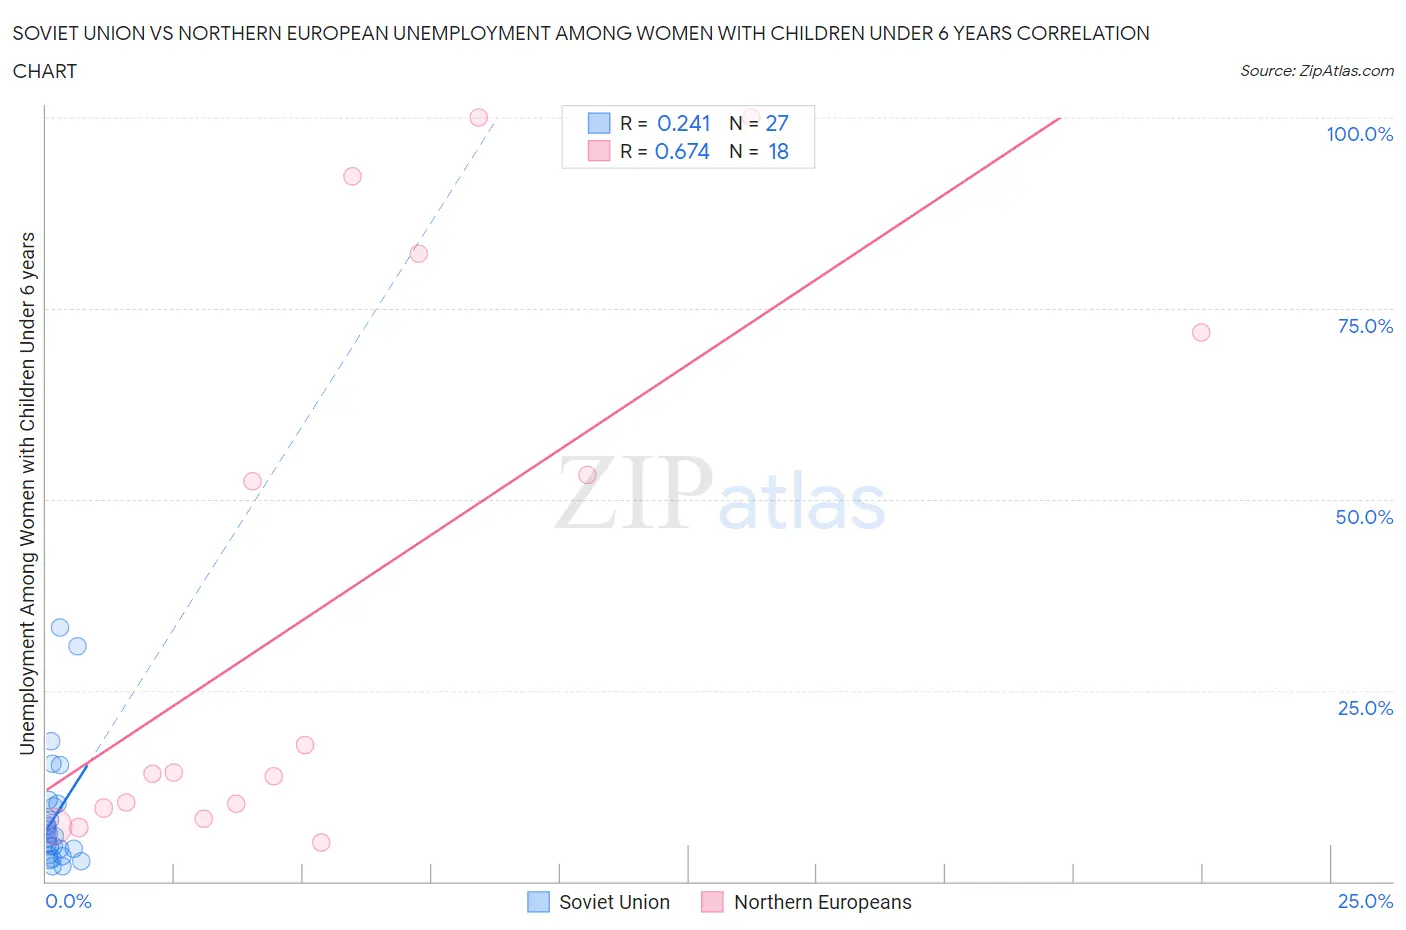
Soviet Union vs Northern European Unemployment Among Women with Children Under 6 years Correlation Chart
The statistical analysis conducted on geographies consisting of 41,253,072 people shows a weak positive correlation between the proportion of Soviet Union and unemployment rate among women with children under the age of 6 in the United States with a correlation coefficient (R) of 0.241 and weighted average of 6.5%. Similarly, the statistical analysis conducted on geographies consisting of 297,166,845 people shows a significant positive correlation between the proportion of Northern Europeans and unemployment rate among women with children under the age of 6 in the United States with a correlation coefficient (R) of 0.674 and weighted average of 7.5%, a difference of 15.0%.
Unemployment Among Women with Children Under 6 years Correlation Summary
| Measurement | Soviet Union | Northern European |
| Minimum | 2.0% | 5.1% |
| Maximum | 33.3% | 100.0% |
| Range | 31.3% | 94.9% |
| Mean | 8.6% | 37.2% |
| Median | 5.8% | 14.2% |
| Interquartile 25% (IQ1) | 3.5% | 9.6% |
| Interquartile 75% (IQ3) | 10.2% | 71.9% |
| Interquartile Range (IQR) | 6.7% | 62.3% |
| Standard Deviation (Sample) | 8.0% | 36.4% |
| Standard Deviation (Population) | 7.8% | 35.4% |
Similar Demographics by Unemployment Among Women with Children Under 6 years
Demographics Similar to Soviet Union by Unemployment Among Women with Children Under 6 years
In terms of unemployment among women with children under 6 years, the demographic groups most similar to Soviet Union are Laotian (6.5%, a difference of 0.020%), Cypriot (6.5%, a difference of 0.080%), Bulgarian (6.5%, a difference of 0.16%), Immigrants from Japan (6.5%, a difference of 0.18%), and Immigrants from Israel (6.5%, a difference of 0.20%).
| Demographics | Rating | Rank | Unemployment Among Women with Children Under 6 years |
| Assyrians/Chaldeans/Syriacs | 100.0 /100 | #18 | Exceptional 6.5% |
| Mongolians | 100.0 /100 | #19 | Exceptional 6.5% |
| Ute | 100.0 /100 | #20 | Exceptional 6.5% |
| Burmese | 100.0 /100 | #21 | Exceptional 6.5% |
| Immigrants | Korea | 100.0 /100 | #22 | Exceptional 6.5% |
| Bulgarians | 100.0 /100 | #23 | Exceptional 6.5% |
| Laotians | 100.0 /100 | #24 | Exceptional 6.5% |
| Soviet Union | 100.0 /100 | #25 | Exceptional 6.5% |
| Cypriots | 100.0 /100 | #26 | Exceptional 6.5% |
| Immigrants | Japan | 100.0 /100 | #27 | Exceptional 6.5% |
| Immigrants | Israel | 100.0 /100 | #28 | Exceptional 6.5% |
| Immigrants | Sweden | 100.0 /100 | #29 | Exceptional 6.6% |
| Immigrants | Belarus | 100.0 /100 | #30 | Exceptional 6.6% |
| Immigrants | Moldova | 100.0 /100 | #31 | Exceptional 6.6% |
| Tsimshian | 100.0 /100 | #32 | Exceptional 6.6% |
Demographics Similar to Northern Europeans by Unemployment Among Women with Children Under 6 years
In terms of unemployment among women with children under 6 years, the demographic groups most similar to Northern Europeans are South American (7.5%, a difference of 0.020%), Uruguayan (7.5%, a difference of 0.030%), Bangladeshi (7.5%, a difference of 0.040%), Immigrants from Peru (7.5%, a difference of 0.050%), and Immigrants from Southern Europe (7.5%, a difference of 0.10%).
| Demographics | Rating | Rank | Unemployment Among Women with Children Under 6 years |
| Immigrants | Oceania | 78.4 /100 | #147 | Good 7.5% |
| Immigrants | Brazil | 77.3 /100 | #148 | Good 7.5% |
| Colombians | 76.1 /100 | #149 | Good 7.5% |
| Aleuts | 76.0 /100 | #150 | Good 7.5% |
| Immigrants | Peru | 74.9 /100 | #151 | Good 7.5% |
| Bangladeshis | 74.8 /100 | #152 | Good 7.5% |
| Uruguayans | 74.7 /100 | #153 | Good 7.5% |
| Northern Europeans | 74.3 /100 | #154 | Good 7.5% |
| South Americans | 74.1 /100 | #155 | Good 7.5% |
| Immigrants | Southern Europe | 73.2 /100 | #156 | Good 7.5% |
| Peruvians | 72.3 /100 | #157 | Good 7.5% |
| Croatians | 71.9 /100 | #158 | Good 7.5% |
| Immigrants | Philippines | 71.3 /100 | #159 | Good 7.5% |
| Bolivians | 70.8 /100 | #160 | Good 7.5% |
| Immigrants | Western Asia | 70.2 /100 | #161 | Good 7.5% |