Soviet Union vs Northern European 9th Grade
COMPARE
Soviet Union
Northern European
9th Grade
9th Grade Comparison
Soviet Union
Northern Europeans
95.4%
9TH GRADE
95.6/ 100
METRIC RATING
119th/ 347
METRIC RANK
96.2%
9TH GRADE
99.9/ 100
METRIC RATING
36th/ 347
METRIC RANK
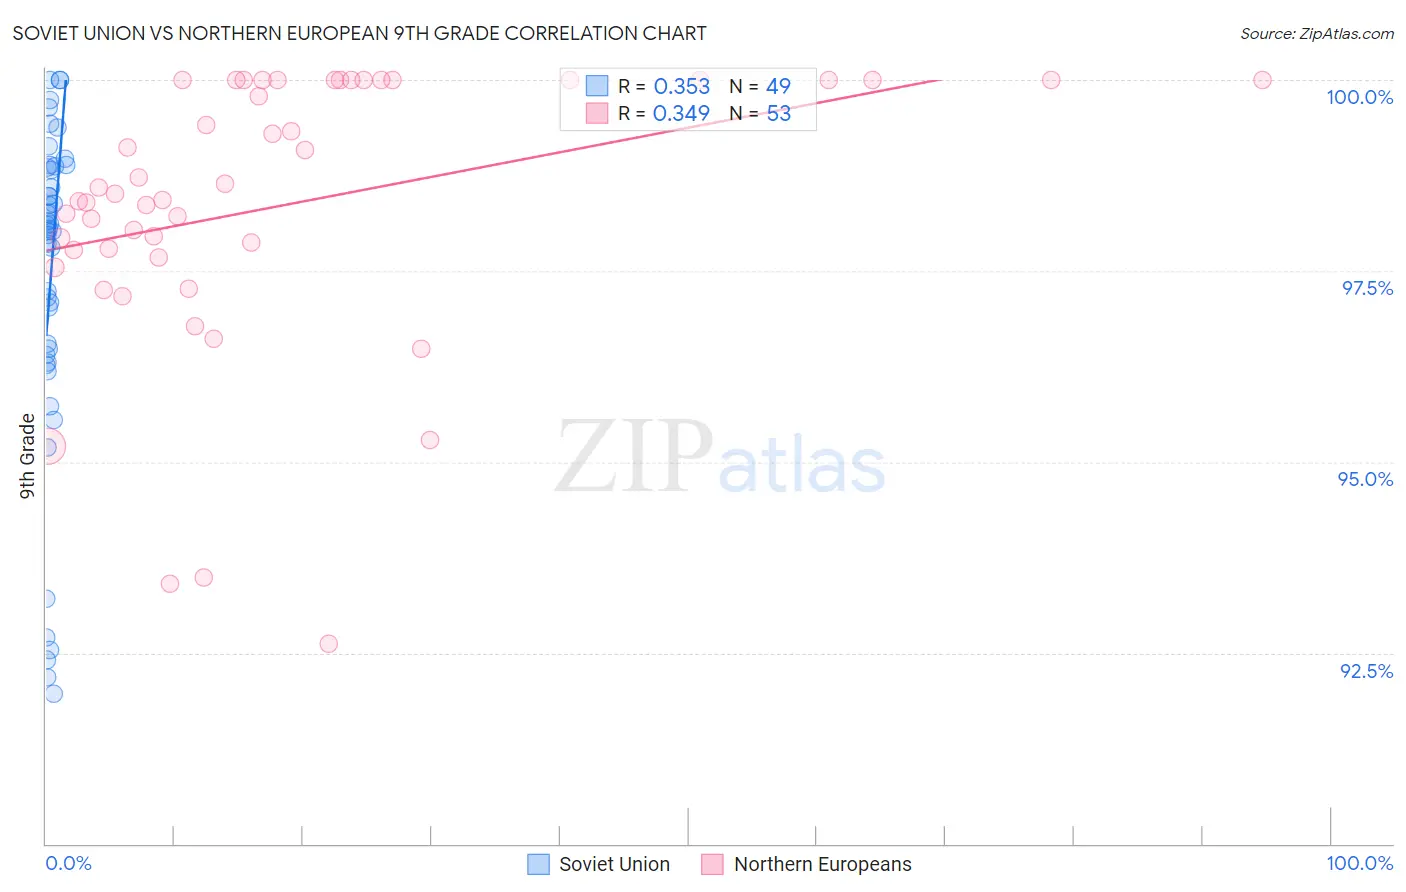
Soviet Union vs Northern European 9th Grade Correlation Chart
The statistical analysis conducted on geographies consisting of 43,454,395 people shows a mild positive correlation between the proportion of Soviet Union and percentage of population with at least 9th grade education in the United States with a correlation coefficient (R) of 0.353 and weighted average of 95.4%. Similarly, the statistical analysis conducted on geographies consisting of 406,096,351 people shows a mild positive correlation between the proportion of Northern Europeans and percentage of population with at least 9th grade education in the United States with a correlation coefficient (R) of 0.349 and weighted average of 96.2%, a difference of 0.81%.
9th Grade Correlation Summary
| Measurement | Soviet Union | Northern European |
| Minimum | 92.0% | 92.6% |
| Maximum | 100.0% | 100.0% |
| Range | 8.0% | 7.4% |
| Mean | 97.3% | 98.4% |
| Median | 98.1% | 98.5% |
| Interquartile 25% (IQ1) | 96.3% | 97.7% |
| Interquartile 75% (IQ3) | 98.9% | 100.0% |
| Interquartile Range (IQR) | 2.5% | 2.3% |
| Standard Deviation (Sample) | 2.2% | 1.8% |
| Standard Deviation (Population) | 2.2% | 1.8% |
Similar Demographics by 9th Grade
Demographics Similar to Soviet Union by 9th Grade
In terms of 9th grade, the demographic groups most similar to Soviet Union are Immigrants from Europe (95.4%, a difference of 0.0%), Immigrants from Romania (95.4%, a difference of 0.0%), Immigrants from Turkey (95.4%, a difference of 0.0%), Cambodian (95.4%, a difference of 0.0%), and Cree (95.4%, a difference of 0.0%).
| Demographics | Rating | Rank | 9th Grade |
| Immigrants | Croatia | 96.2 /100 | #112 | Exceptional 95.4% |
| Iroquois | 96.2 /100 | #113 | Exceptional 95.4% |
| German Russians | 96.1 /100 | #114 | Exceptional 95.4% |
| Burmese | 96.0 /100 | #115 | Exceptional 95.4% |
| Immigrants | Europe | 95.7 /100 | #116 | Exceptional 95.4% |
| Immigrants | Romania | 95.6 /100 | #117 | Exceptional 95.4% |
| Immigrants | Turkey | 95.6 /100 | #118 | Exceptional 95.4% |
| Soviet Union | 95.6 /100 | #119 | Exceptional 95.4% |
| Cambodians | 95.6 /100 | #120 | Exceptional 95.4% |
| Cree | 95.5 /100 | #121 | Exceptional 95.4% |
| Immigrants | Kuwait | 95.5 /100 | #122 | Exceptional 95.4% |
| Kiowa | 95.3 /100 | #123 | Exceptional 95.4% |
| Shoshone | 95.3 /100 | #124 | Exceptional 95.4% |
| Immigrants | South Central Asia | 95.1 /100 | #125 | Exceptional 95.4% |
| Immigrants | Serbia | 94.4 /100 | #126 | Exceptional 95.4% |
Demographics Similar to Northern Europeans by 9th Grade
In terms of 9th grade, the demographic groups most similar to Northern Europeans are Bulgarian (96.2%, a difference of 0.010%), Hungarian (96.2%, a difference of 0.040%), Estonian (96.1%, a difference of 0.040%), Immigrants from Scotland (96.1%, a difference of 0.040%), and Ottawa (96.1%, a difference of 0.060%).
| Demographics | Rating | Rank | 9th Grade |
| Chinese | 100.0 /100 | #29 | Exceptional 96.3% |
| Maltese | 100.0 /100 | #30 | Exceptional 96.3% |
| British | 100.0 /100 | #31 | Exceptional 96.3% |
| Belgians | 100.0 /100 | #32 | Exceptional 96.3% |
| Luxembourgers | 100.0 /100 | #33 | Exceptional 96.3% |
| Hungarians | 100.0 /100 | #34 | Exceptional 96.2% |
| Bulgarians | 99.9 /100 | #35 | Exceptional 96.2% |
| Northern Europeans | 99.9 /100 | #36 | Exceptional 96.2% |
| Estonians | 99.9 /100 | #37 | Exceptional 96.1% |
| Immigrants | Scotland | 99.9 /100 | #38 | Exceptional 96.1% |
| Ottawa | 99.9 /100 | #39 | Exceptional 96.1% |
| Slavs | 99.9 /100 | #40 | Exceptional 96.1% |
| Czechoslovakians | 99.9 /100 | #41 | Exceptional 96.1% |
| Chippewa | 99.9 /100 | #42 | Exceptional 96.1% |
| Iranians | 99.9 /100 | #43 | Exceptional 96.1% |