Slovene vs Choctaw 2 or more Vehicles in Household
COMPARE
Slovene
Choctaw
2 or more Vehicles in Household
2 or more Vehicles in Household Comparison
Slovenes
Choctaw
58.3%
2 OR MORE VEHICLES IN HOUSEHOLD
99.5/ 100
METRIC RATING
77th/ 347
METRIC RANK
59.3%
2 OR MORE VEHICLES IN HOUSEHOLD
99.9/ 100
METRIC RATING
50th/ 347
METRIC RANK
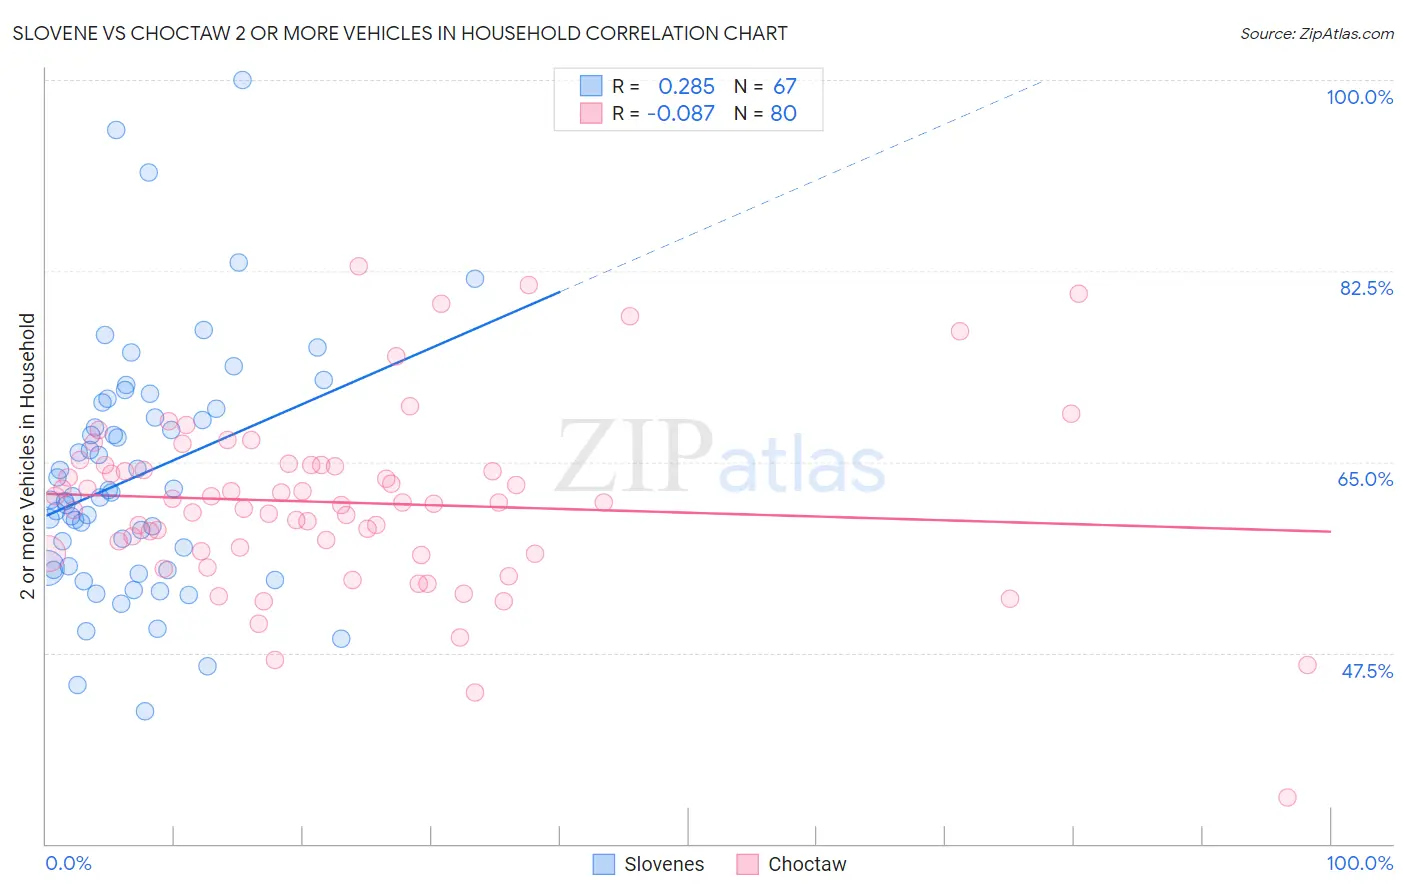
Slovene vs Choctaw 2 or more Vehicles in Household Correlation Chart
The statistical analysis conducted on geographies consisting of 261,272,828 people shows a weak positive correlation between the proportion of Slovenes and percentage of households with 2 or more vehicles available in the United States with a correlation coefficient (R) of 0.285 and weighted average of 58.3%. Similarly, the statistical analysis conducted on geographies consisting of 269,636,757 people shows a slight negative correlation between the proportion of Choctaw and percentage of households with 2 or more vehicles available in the United States with a correlation coefficient (R) of -0.087 and weighted average of 59.3%, a difference of 1.7%.
2 or more Vehicles in Household Correlation Summary
| Measurement | Slovene | Choctaw |
| Minimum | 42.1% | 34.2% |
| Maximum | 100.0% | 83.0% |
| Range | 57.9% | 48.7% |
| Mean | 63.7% | 61.3% |
| Median | 61.9% | 61.3% |
| Interquartile 25% (IQ1) | 55.3% | 56.7% |
| Interquartile 75% (IQ3) | 69.9% | 64.7% |
| Interquartile Range (IQR) | 14.6% | 8.0% |
| Standard Deviation (Sample) | 11.2% | 8.3% |
| Standard Deviation (Population) | 11.1% | 8.2% |
Similar Demographics by 2 or more Vehicles in Household
Demographics Similar to Slovenes by 2 or more Vehicles in Household
In terms of 2 or more vehicles in household, the demographic groups most similar to Slovenes are Creek (58.3%, a difference of 0.010%), Polish (58.3%, a difference of 0.040%), Lithuanian (58.2%, a difference of 0.050%), Bolivian (58.3%, a difference of 0.12%), and Immigrants from Afghanistan (58.3%, a difference of 0.12%).
| Demographics | Rating | Rank | 2 or more Vehicles in Household |
| Italians | 99.6 /100 | #70 | Exceptional 58.4% |
| Bangladeshis | 99.6 /100 | #71 | Exceptional 58.4% |
| Austrians | 99.6 /100 | #72 | Exceptional 58.4% |
| Bolivians | 99.6 /100 | #73 | Exceptional 58.3% |
| Immigrants | Afghanistan | 99.6 /100 | #74 | Exceptional 58.3% |
| Poles | 99.5 /100 | #75 | Exceptional 58.3% |
| Creek | 99.5 /100 | #76 | Exceptional 58.3% |
| Slovenes | 99.5 /100 | #77 | Exceptional 58.3% |
| Lithuanians | 99.5 /100 | #78 | Exceptional 58.2% |
| Delaware | 99.4 /100 | #79 | Exceptional 58.2% |
| Immigrants | England | 99.3 /100 | #80 | Exceptional 58.1% |
| Immigrants | Iraq | 99.3 /100 | #81 | Exceptional 58.1% |
| Iranians | 99.3 /100 | #82 | Exceptional 58.1% |
| Icelanders | 99.2 /100 | #83 | Exceptional 58.0% |
| Maltese | 99.2 /100 | #84 | Exceptional 58.0% |
Demographics Similar to Choctaw by 2 or more Vehicles in Household
In terms of 2 or more vehicles in household, the demographic groups most similar to Choctaw are Belgian (59.3%, a difference of 0.010%), Immigrants from India (59.3%, a difference of 0.040%), Yaqui (59.3%, a difference of 0.060%), Spaniard (59.2%, a difference of 0.14%), and Immigrants from Laos (59.2%, a difference of 0.14%).
| Demographics | Rating | Rank | 2 or more Vehicles in Household |
| Czechoslovakians | 100.0 /100 | #43 | Exceptional 59.8% |
| French | 100.0 /100 | #44 | Exceptional 59.8% |
| Immigrants | Taiwan | 100.0 /100 | #45 | Exceptional 59.7% |
| Immigrants | South Eastern Asia | 100.0 /100 | #46 | Exceptional 59.6% |
| Yaqui | 99.9 /100 | #47 | Exceptional 59.3% |
| Immigrants | India | 99.9 /100 | #48 | Exceptional 59.3% |
| Belgians | 99.9 /100 | #49 | Exceptional 59.3% |
| Choctaw | 99.9 /100 | #50 | Exceptional 59.3% |
| Spaniards | 99.9 /100 | #51 | Exceptional 59.2% |
| Immigrants | Laos | 99.9 /100 | #52 | Exceptional 59.2% |
| Celtics | 99.9 /100 | #53 | Exceptional 59.2% |
| Bhutanese | 99.9 /100 | #54 | Exceptional 59.1% |
| Luxembourgers | 99.9 /100 | #55 | Exceptional 59.1% |
| Chickasaw | 99.9 /100 | #56 | Exceptional 59.0% |
| Afghans | 99.9 /100 | #57 | Exceptional 59.0% |