Hopi vs Macedonian No Vehicles in Household
COMPARE
Hopi
Macedonian
No Vehicles in Household
No Vehicles in Household Comparison
Hopi
Macedonians
13.7%
NO VEHICLES IN HOUSEHOLD
0.0/ 100
METRIC RATING
288th/ 347
METRIC RANK
12.2%
NO VEHICLES IN HOUSEHOLD
0.7/ 100
METRIC RATING
260th/ 347
METRIC RANK
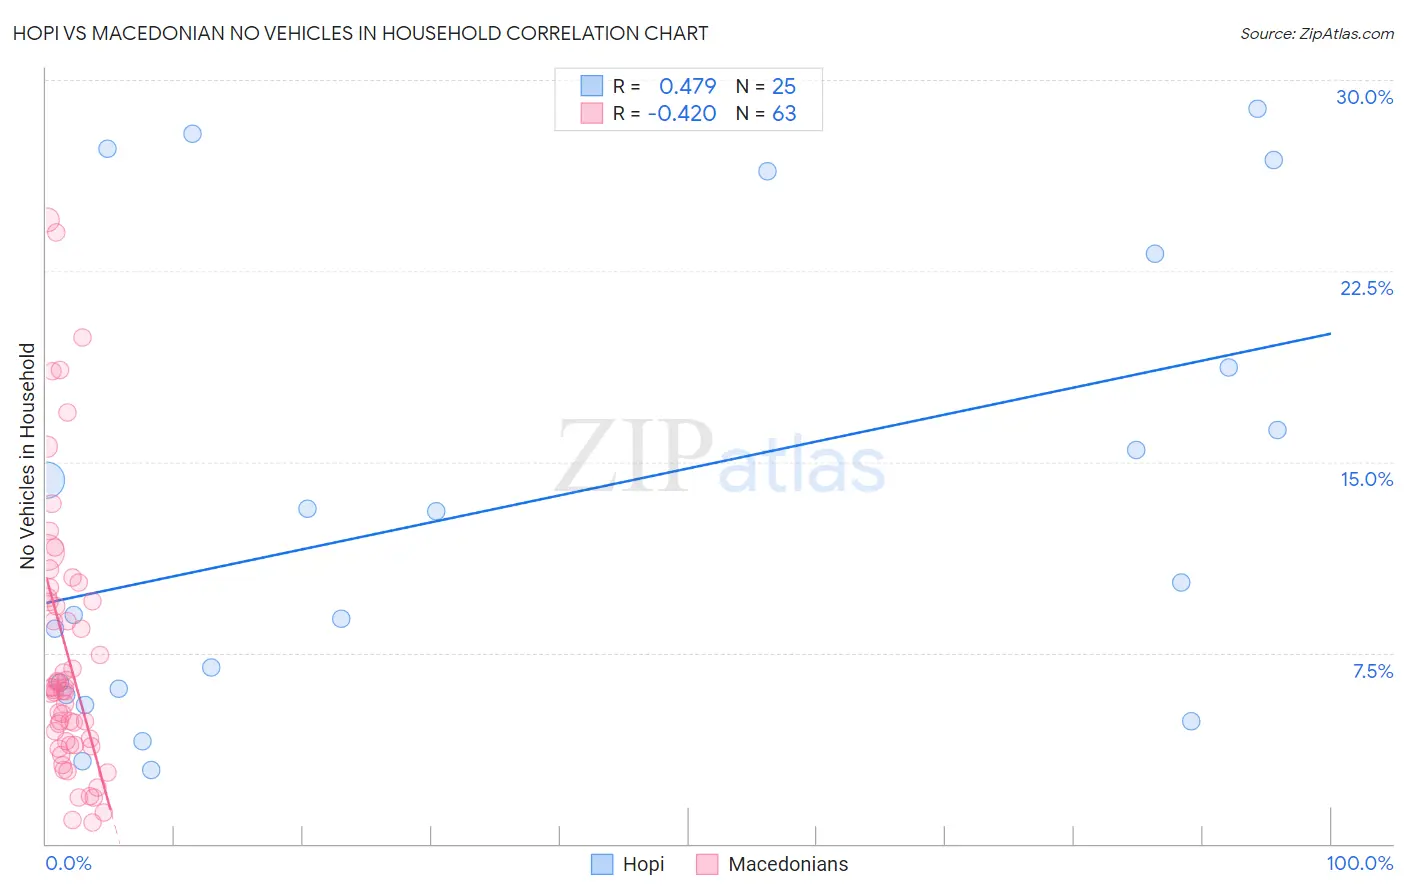
Hopi vs Macedonian No Vehicles in Household Correlation Chart
The statistical analysis conducted on geographies consisting of 74,700,452 people shows a moderate positive correlation between the proportion of Hopi and percentage of households with no vehicle available in the United States with a correlation coefficient (R) of 0.479 and weighted average of 13.7%. Similarly, the statistical analysis conducted on geographies consisting of 132,434,178 people shows a moderate negative correlation between the proportion of Macedonians and percentage of households with no vehicle available in the United States with a correlation coefficient (R) of -0.420 and weighted average of 12.2%, a difference of 12.9%.
No Vehicles in Household Correlation Summary
| Measurement | Hopi | Macedonian |
| Minimum | 2.9% | 0.82% |
| Maximum | 28.9% | 24.5% |
| Range | 26.0% | 23.7% |
| Mean | 13.3% | 7.5% |
| Median | 10.2% | 6.0% |
| Interquartile 25% (IQ1) | 5.9% | 3.9% |
| Interquartile 75% (IQ3) | 20.9% | 9.7% |
| Interquartile Range (IQR) | 15.0% | 5.8% |
| Standard Deviation (Sample) | 8.8% | 5.3% |
| Standard Deviation (Population) | 8.6% | 5.3% |
Similar Demographics by No Vehicles in Household
Demographics Similar to Hopi by No Vehicles in Household
In terms of no vehicles in household, the demographic groups most similar to Hopi are Immigrants from Ireland (13.7%, a difference of 0.13%), Colville (13.7%, a difference of 0.35%), Immigrants from Australia (13.8%, a difference of 0.66%), Immigrants from Eastern Europe (13.6%, a difference of 1.0%), and Immigrants from Malaysia (13.6%, a difference of 1.1%).
| Demographics | Rating | Rank | No Vehicles in Household |
| Central American Indians | 0.0 /100 | #281 | Tragic 13.3% |
| Immigrants | Eastern Asia | 0.0 /100 | #282 | Tragic 13.5% |
| Immigrants | Kazakhstan | 0.0 /100 | #283 | Tragic 13.6% |
| Immigrants | Malaysia | 0.0 /100 | #284 | Tragic 13.6% |
| Immigrants | Eastern Europe | 0.0 /100 | #285 | Tragic 13.6% |
| Colville | 0.0 /100 | #286 | Tragic 13.7% |
| Immigrants | Ireland | 0.0 /100 | #287 | Tragic 13.7% |
| Hopi | 0.0 /100 | #288 | Tragic 13.7% |
| Immigrants | Australia | 0.0 /100 | #289 | Tragic 13.8% |
| Indians (Asian) | 0.0 /100 | #290 | Tragic 14.1% |
| Okinawans | 0.0 /100 | #291 | Tragic 14.1% |
| Pima | 0.0 /100 | #292 | Tragic 14.1% |
| Immigrants | Jamaica | 0.0 /100 | #293 | Tragic 14.2% |
| Belizeans | 0.0 /100 | #294 | Tragic 14.3% |
| Paraguayans | 0.0 /100 | #295 | Tragic 14.4% |
Demographics Similar to Macedonians by No Vehicles in Household
In terms of no vehicles in household, the demographic groups most similar to Macedonians are Subsaharan African (12.2%, a difference of 0.39%), Immigrants from Liberia (12.2%, a difference of 0.46%), Immigrants from Latvia (12.1%, a difference of 0.55%), Immigrants from Egypt (12.2%, a difference of 0.61%), and South American Indian (12.1%, a difference of 0.80%).
| Demographics | Rating | Rank | No Vehicles in Household |
| Egyptians | 1.4 /100 | #253 | Tragic 11.9% |
| Immigrants | Uruguay | 1.3 /100 | #254 | Tragic 11.9% |
| Hondurans | 1.2 /100 | #255 | Tragic 12.0% |
| Liberians | 1.2 /100 | #256 | Tragic 12.0% |
| Nigerians | 0.9 /100 | #257 | Tragic 12.1% |
| South American Indians | 0.9 /100 | #258 | Tragic 12.1% |
| Immigrants | Latvia | 0.8 /100 | #259 | Tragic 12.1% |
| Macedonians | 0.7 /100 | #260 | Tragic 12.2% |
| Sub-Saharan Africans | 0.6 /100 | #261 | Tragic 12.2% |
| Immigrants | Liberia | 0.6 /100 | #262 | Tragic 12.2% |
| Immigrants | Egypt | 0.6 /100 | #263 | Tragic 12.2% |
| Immigrants | Switzerland | 0.5 /100 | #264 | Tragic 12.3% |
| Africans | 0.4 /100 | #265 | Tragic 12.3% |
| Israelis | 0.3 /100 | #266 | Tragic 12.4% |
| Immigrants | Europe | 0.3 /100 | #267 | Tragic 12.5% |