Tohono O'odham vs Macedonian No Vehicles in Household
COMPARE
Tohono O'odham
Macedonian
No Vehicles in Household
No Vehicles in Household Comparison
Tohono O'odham
Macedonians
15.6%
NO VEHICLES IN HOUSEHOLD
0.0/ 100
METRIC RATING
313th/ 347
METRIC RANK
12.2%
NO VEHICLES IN HOUSEHOLD
0.7/ 100
METRIC RATING
260th/ 347
METRIC RANK
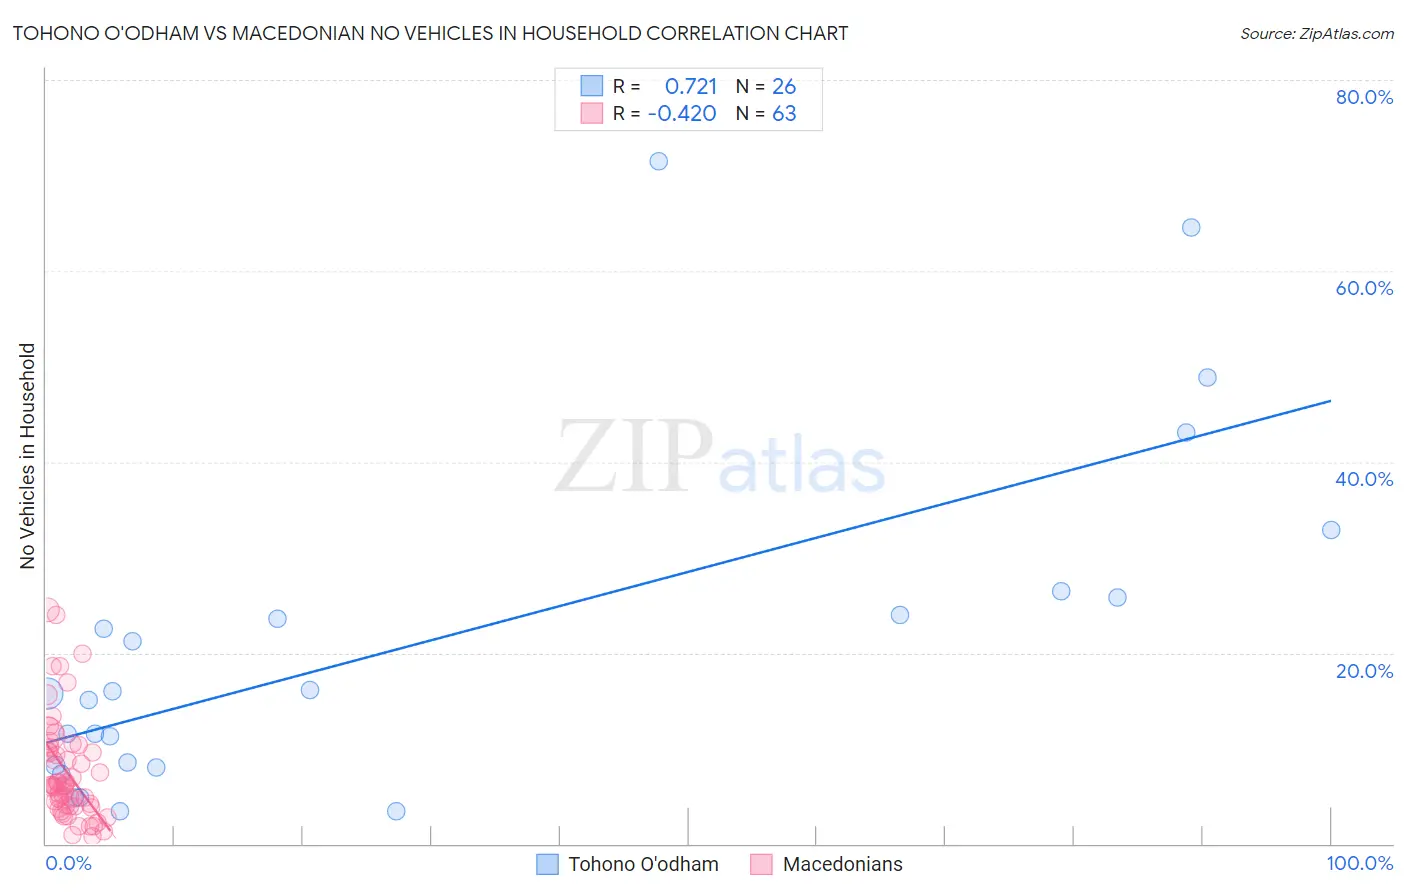
Tohono O'odham vs Macedonian No Vehicles in Household Correlation Chart
The statistical analysis conducted on geographies consisting of 58,684,775 people shows a strong positive correlation between the proportion of Tohono O'odham and percentage of households with no vehicle available in the United States with a correlation coefficient (R) of 0.721 and weighted average of 15.6%. Similarly, the statistical analysis conducted on geographies consisting of 132,434,178 people shows a moderate negative correlation between the proportion of Macedonians and percentage of households with no vehicle available in the United States with a correlation coefficient (R) of -0.420 and weighted average of 12.2%, a difference of 28.5%.
No Vehicles in Household Correlation Summary
| Measurement | Tohono O'odham | Macedonian |
| Minimum | 3.4% | 0.82% |
| Maximum | 71.4% | 24.5% |
| Range | 68.0% | 23.7% |
| Mean | 21.2% | 7.5% |
| Median | 15.8% | 6.0% |
| Interquartile 25% (IQ1) | 8.2% | 3.9% |
| Interquartile 75% (IQ3) | 25.8% | 9.7% |
| Interquartile Range (IQR) | 17.5% | 5.8% |
| Standard Deviation (Sample) | 18.0% | 5.3% |
| Standard Deviation (Population) | 17.7% | 5.3% |
Similar Demographics by No Vehicles in Household
Demographics Similar to Tohono O'odham by No Vehicles in Household
In terms of no vehicles in household, the demographic groups most similar to Tohono O'odham are Alaskan Athabascan (15.6%, a difference of 0.15%), Albanian (15.6%, a difference of 0.16%), Cypriot (15.7%, a difference of 0.29%), Immigrants from Israel (15.6%, a difference of 0.30%), and Cape Verdean (15.6%, a difference of 0.31%).
| Demographics | Rating | Rank | No Vehicles in Household |
| Immigrants | Belize | 0.0 /100 | #306 | Tragic 15.4% |
| Immigrants | Haiti | 0.0 /100 | #307 | Tragic 15.4% |
| U.S. Virgin Islanders | 0.0 /100 | #308 | Tragic 15.4% |
| Puerto Ricans | 0.0 /100 | #309 | Tragic 15.5% |
| Cape Verdeans | 0.0 /100 | #310 | Tragic 15.6% |
| Immigrants | Israel | 0.0 /100 | #311 | Tragic 15.6% |
| Alaskan Athabascans | 0.0 /100 | #312 | Tragic 15.6% |
| Tohono O'odham | 0.0 /100 | #313 | Tragic 15.6% |
| Albanians | 0.0 /100 | #314 | Tragic 15.6% |
| Cypriots | 0.0 /100 | #315 | Tragic 15.7% |
| Ghanaians | 0.0 /100 | #316 | Tragic 16.4% |
| Immigrants | Ghana | 0.0 /100 | #317 | Tragic 16.6% |
| Immigrants | Belarus | 0.0 /100 | #318 | Tragic 16.7% |
| Alaska Natives | 0.0 /100 | #319 | Tragic 17.4% |
| Soviet Union | 0.0 /100 | #320 | Tragic 17.4% |
Demographics Similar to Macedonians by No Vehicles in Household
In terms of no vehicles in household, the demographic groups most similar to Macedonians are Subsaharan African (12.2%, a difference of 0.39%), Immigrants from Liberia (12.2%, a difference of 0.46%), Immigrants from Latvia (12.1%, a difference of 0.55%), Immigrants from Egypt (12.2%, a difference of 0.61%), and South American Indian (12.1%, a difference of 0.80%).
| Demographics | Rating | Rank | No Vehicles in Household |
| Egyptians | 1.4 /100 | #253 | Tragic 11.9% |
| Immigrants | Uruguay | 1.3 /100 | #254 | Tragic 11.9% |
| Hondurans | 1.2 /100 | #255 | Tragic 12.0% |
| Liberians | 1.2 /100 | #256 | Tragic 12.0% |
| Nigerians | 0.9 /100 | #257 | Tragic 12.1% |
| South American Indians | 0.9 /100 | #258 | Tragic 12.1% |
| Immigrants | Latvia | 0.8 /100 | #259 | Tragic 12.1% |
| Macedonians | 0.7 /100 | #260 | Tragic 12.2% |
| Sub-Saharan Africans | 0.6 /100 | #261 | Tragic 12.2% |
| Immigrants | Liberia | 0.6 /100 | #262 | Tragic 12.2% |
| Immigrants | Egypt | 0.6 /100 | #263 | Tragic 12.2% |
| Immigrants | Switzerland | 0.5 /100 | #264 | Tragic 12.3% |
| Africans | 0.4 /100 | #265 | Tragic 12.3% |
| Israelis | 0.3 /100 | #266 | Tragic 12.4% |
| Immigrants | Europe | 0.3 /100 | #267 | Tragic 12.5% |