Russian vs Immigrants from Korea 2 or more Vehicles in Household
COMPARE
Russian
Immigrants from Korea
2 or more Vehicles in Household
2 or more Vehicles in Household Comparison
Russians
Immigrants from Korea
54.8%
2 OR MORE VEHICLES IN HOUSEHOLD
26.3/ 100
METRIC RATING
190th/ 347
METRIC RANK
57.6%
2 OR MORE VEHICLES IN HOUSEHOLD
98.2/ 100
METRIC RATING
105th/ 347
METRIC RANK
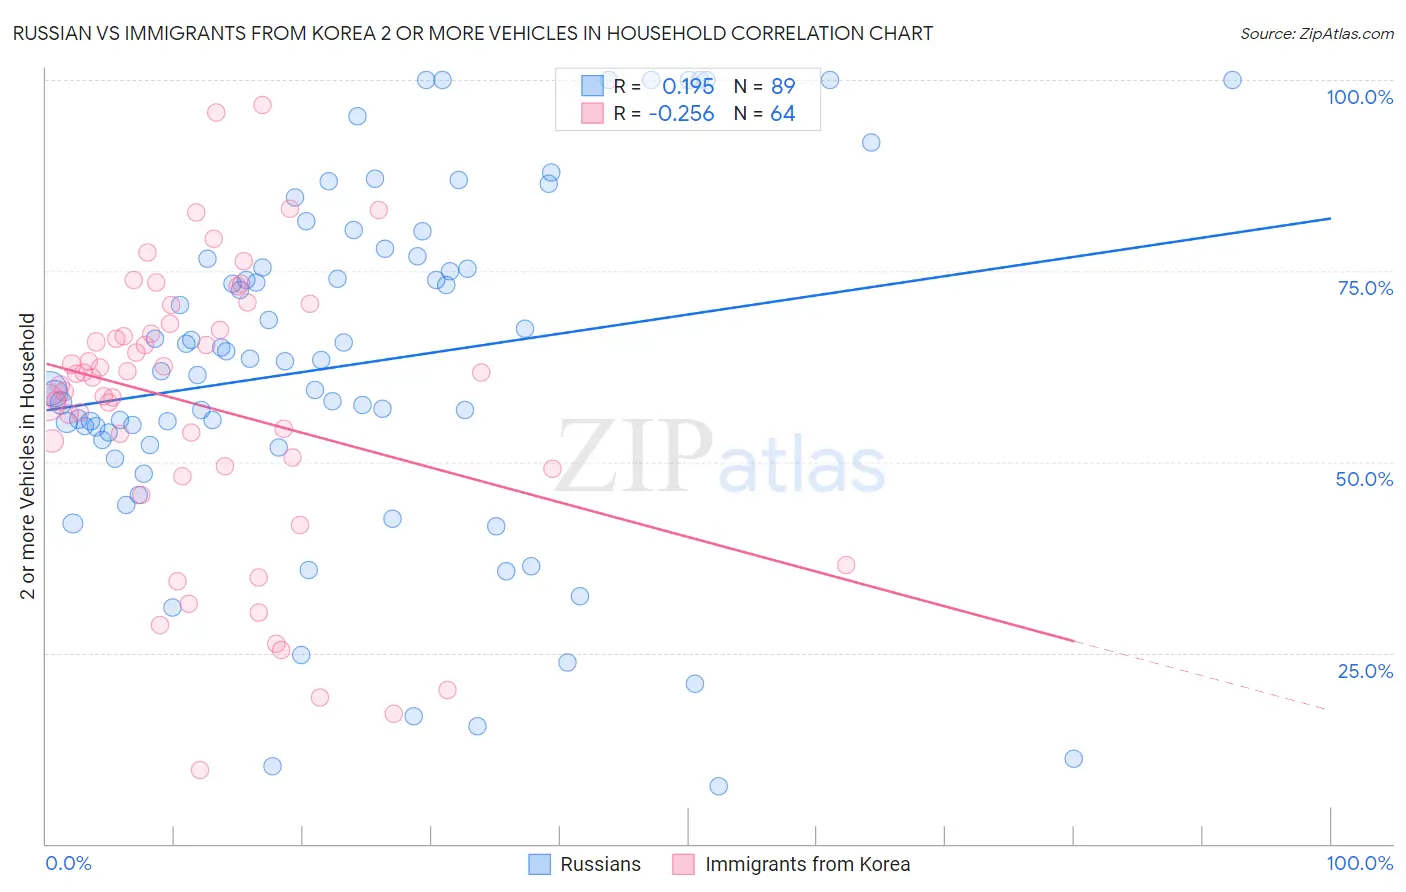
Russian vs Immigrants from Korea 2 or more Vehicles in Household Correlation Chart
The statistical analysis conducted on geographies consisting of 511,789,622 people shows a poor positive correlation between the proportion of Russians and percentage of households with 2 or more vehicles available in the United States with a correlation coefficient (R) of 0.195 and weighted average of 54.8%. Similarly, the statistical analysis conducted on geographies consisting of 416,005,379 people shows a weak negative correlation between the proportion of Immigrants from Korea and percentage of households with 2 or more vehicles available in the United States with a correlation coefficient (R) of -0.256 and weighted average of 57.6%, a difference of 5.1%.
2 or more Vehicles in Household Correlation Summary
| Measurement | Russian | Immigrants from Korea |
| Minimum | 7.6% | 9.7% |
| Maximum | 100.0% | 96.7% |
| Range | 92.4% | 86.9% |
| Mean | 62.7% | 57.3% |
| Median | 63.1% | 61.3% |
| Interquartile 25% (IQ1) | 52.5% | 49.3% |
| Interquartile 75% (IQ3) | 76.7% | 67.7% |
| Interquartile Range (IQR) | 24.2% | 18.4% |
| Standard Deviation (Sample) | 22.8% | 18.6% |
| Standard Deviation (Population) | 22.7% | 18.5% |
Similar Demographics by 2 or more Vehicles in Household
Demographics Similar to Russians by 2 or more Vehicles in Household
In terms of 2 or more vehicles in household, the demographic groups most similar to Russians are Eastern European (54.8%, a difference of 0.060%), Immigrants (54.7%, a difference of 0.070%), Immigrants from Romania (54.7%, a difference of 0.13%), Immigrants from Japan (54.7%, a difference of 0.16%), and Central American (54.7%, a difference of 0.18%).
| Demographics | Rating | Rank | 2 or more Vehicles in Household |
| Immigrants | Cameroon | 37.3 /100 | #183 | Fair 55.1% |
| Apache | 36.7 /100 | #184 | Fair 55.1% |
| Arabs | 35.9 /100 | #185 | Fair 55.0% |
| Peruvians | 33.7 /100 | #186 | Fair 55.0% |
| Immigrants | Uganda | 33.4 /100 | #187 | Fair 55.0% |
| Marshallese | 30.5 /100 | #188 | Fair 54.9% |
| Eastern Europeans | 27.5 /100 | #189 | Fair 54.8% |
| Russians | 26.3 /100 | #190 | Fair 54.8% |
| Immigrants | Immigrants | 25.0 /100 | #191 | Fair 54.7% |
| Immigrants | Romania | 23.8 /100 | #192 | Fair 54.7% |
| Immigrants | Japan | 23.4 /100 | #193 | Fair 54.7% |
| Central Americans | 23.0 /100 | #194 | Fair 54.7% |
| Iroquois | 22.6 /100 | #195 | Fair 54.7% |
| Immigrants | Poland | 19.3 /100 | #196 | Poor 54.6% |
| Argentineans | 17.5 /100 | #197 | Poor 54.5% |
Demographics Similar to Immigrants from Korea by 2 or more Vehicles in Household
In terms of 2 or more vehicles in household, the demographic groups most similar to Immigrants from Korea are Immigrants from Indonesia (57.6%, a difference of 0.0%), Immigrants from Bolivia (57.6%, a difference of 0.010%), Jordanian (57.6%, a difference of 0.010%), Immigrants from Oceania (57.5%, a difference of 0.020%), and Immigrants from Netherlands (57.5%, a difference of 0.030%).
| Demographics | Rating | Rank | 2 or more Vehicles in Household |
| Palestinians | 98.6 /100 | #98 | Exceptional 57.7% |
| Cajuns | 98.5 /100 | #99 | Exceptional 57.7% |
| Fijians | 98.4 /100 | #100 | Exceptional 57.6% |
| Lebanese | 98.3 /100 | #101 | Exceptional 57.6% |
| Immigrants | Bolivia | 98.2 /100 | #102 | Exceptional 57.6% |
| Jordanians | 98.2 /100 | #103 | Exceptional 57.6% |
| Immigrants | Indonesia | 98.2 /100 | #104 | Exceptional 57.6% |
| Immigrants | Korea | 98.2 /100 | #105 | Exceptional 57.6% |
| Immigrants | Oceania | 98.2 /100 | #106 | Exceptional 57.5% |
| Immigrants | Netherlands | 98.2 /100 | #107 | Exceptional 57.5% |
| Immigrants | Canada | 98.1 /100 | #108 | Exceptional 57.5% |
| Immigrants | North America | 98.1 /100 | #109 | Exceptional 57.5% |
| Japanese | 98.0 /100 | #110 | Exceptional 57.5% |
| Greeks | 98.0 /100 | #111 | Exceptional 57.5% |
| Pueblo | 98.0 /100 | #112 | Exceptional 57.5% |