Immigrants from Austria vs Inupiat 1 or more Vehicles in Household
COMPARE
Immigrants from Austria
Inupiat
1 or more Vehicles in Household
1 or more Vehicles in Household Comparison
Immigrants from Austria
Inupiat
89.9%
1 OR MORE VEHICLES IN HOUSEHOLD
65.5/ 100
METRIC RATING
163rd/ 347
METRIC RANK
71.5%
1 OR MORE VEHICLES IN HOUSEHOLD
0.0/ 100
METRIC RATING
338th/ 347
METRIC RANK
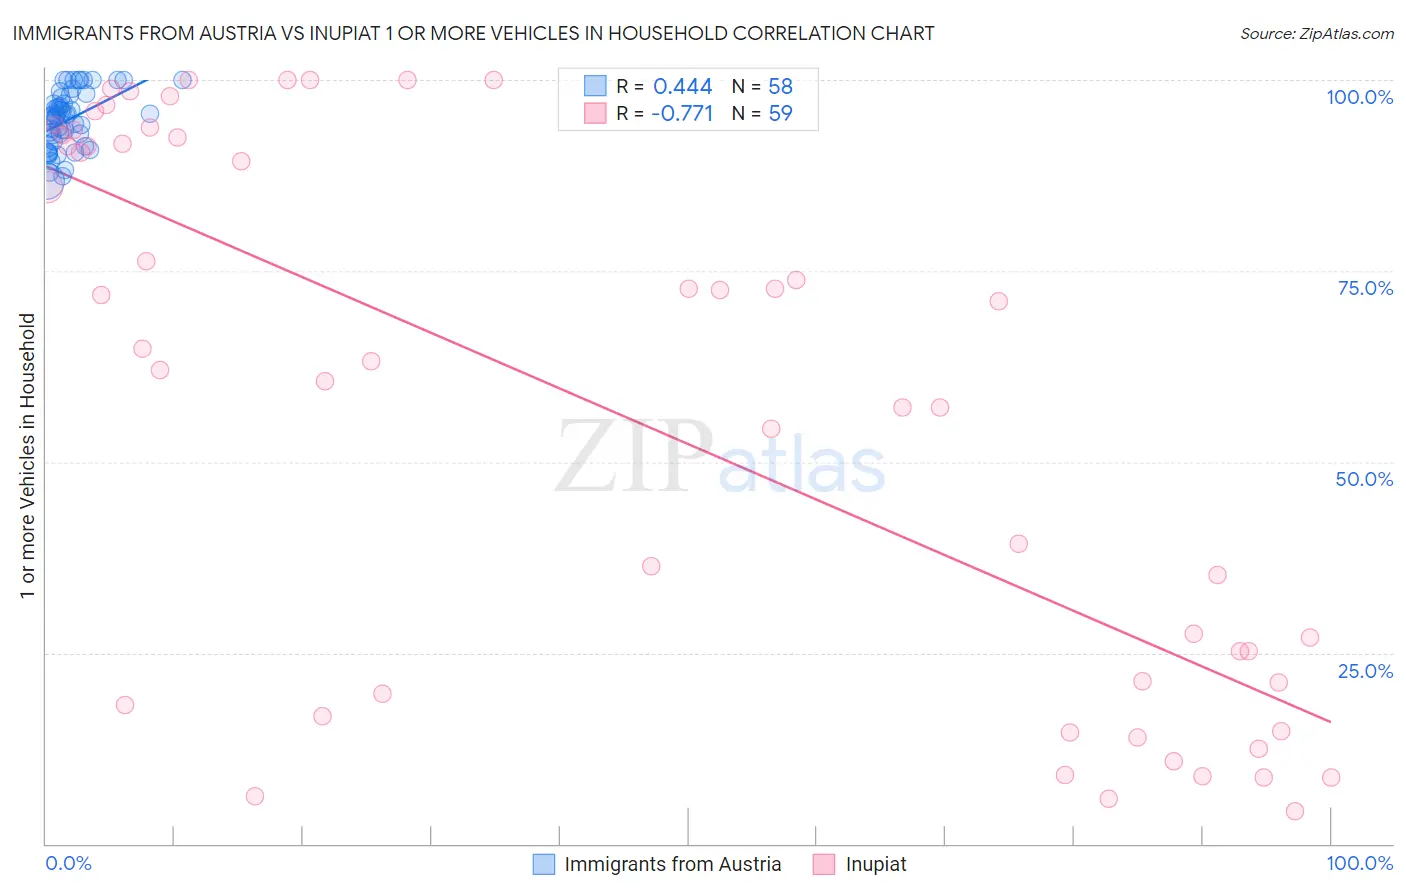
Immigrants from Austria vs Inupiat 1 or more Vehicles in Household Correlation Chart
The statistical analysis conducted on geographies consisting of 167,940,062 people shows a moderate positive correlation between the proportion of Immigrants from Austria and percentage of households with 1 or more vehicles available in the United States with a correlation coefficient (R) of 0.444 and weighted average of 89.9%. Similarly, the statistical analysis conducted on geographies consisting of 96,318,712 people shows a strong negative correlation between the proportion of Inupiat and percentage of households with 1 or more vehicles available in the United States with a correlation coefficient (R) of -0.771 and weighted average of 71.5%, a difference of 25.7%.
1 or more Vehicles in Household Correlation Summary
| Measurement | Immigrants from Austria | Inupiat |
| Minimum | 86.7% | 4.2% |
| Maximum | 100.0% | 100.0% |
| Range | 13.3% | 95.8% |
| Mean | 94.8% | 56.9% |
| Median | 95.4% | 63.2% |
| Interquartile 25% (IQ1) | 91.9% | 19.7% |
| Interquartile 75% (IQ3) | 97.7% | 92.5% |
| Interquartile Range (IQR) | 5.8% | 72.8% |
| Standard Deviation (Sample) | 3.7% | 35.1% |
| Standard Deviation (Population) | 3.7% | 34.8% |
Similar Demographics by 1 or more Vehicles in Household
Demographics Similar to Immigrants from Austria by 1 or more Vehicles in Household
In terms of 1 or more vehicles in household, the demographic groups most similar to Immigrants from Austria are Spanish American Indian (89.9%, a difference of 0.030%), Comanche (89.9%, a difference of 0.040%), Immigrants from Saudi Arabia (89.9%, a difference of 0.050%), Immigrants from Indonesia (90.0%, a difference of 0.060%), and Salvadoran (90.0%, a difference of 0.060%).
| Demographics | Rating | Rank | 1 or more Vehicles in Household |
| Australians | 72.4 /100 | #156 | Good 90.0% |
| Immigrants | Congo | 71.2 /100 | #157 | Good 90.0% |
| Brazilians | 71.0 /100 | #158 | Good 90.0% |
| South Africans | 69.7 /100 | #159 | Good 90.0% |
| Immigrants | Indonesia | 68.8 /100 | #160 | Good 90.0% |
| Salvadorans | 68.7 /100 | #161 | Good 90.0% |
| Spanish American Indians | 67.0 /100 | #162 | Good 89.9% |
| Immigrants | Austria | 65.5 /100 | #163 | Good 89.9% |
| Comanche | 63.4 /100 | #164 | Good 89.9% |
| Immigrants | Saudi Arabia | 62.6 /100 | #165 | Good 89.9% |
| Immigrants | Middle Africa | 62.2 /100 | #166 | Good 89.9% |
| Immigrants | Latin America | 60.3 /100 | #167 | Good 89.8% |
| Immigrants | Cambodia | 60.1 /100 | #168 | Good 89.8% |
| Natives/Alaskans | 59.5 /100 | #169 | Average 89.8% |
| Immigrants | Costa Rica | 57.6 /100 | #170 | Average 89.8% |
Demographics Similar to Inupiat by 1 or more Vehicles in Household
In terms of 1 or more vehicles in household, the demographic groups most similar to Inupiat are Guyanese (70.8%, a difference of 1.0%), Dominican (70.7%, a difference of 1.2%), Immigrants from Barbados (70.6%, a difference of 1.3%), Immigrants from Guyana (70.6%, a difference of 1.4%), and British West Indian (70.4%, a difference of 1.7%).
| Demographics | Rating | Rank | 1 or more Vehicles in Household |
| West Indians | 0.0 /100 | #331 | Tragic 76.4% |
| Trinidadians and Tobagonians | 0.0 /100 | #332 | Tragic 76.3% |
| Immigrants | Ecuador | 0.0 /100 | #333 | Tragic 76.2% |
| Immigrants | Bangladesh | 0.0 /100 | #334 | Tragic 74.3% |
| Barbadians | 0.0 /100 | #335 | Tragic 74.0% |
| Vietnamese | 0.0 /100 | #336 | Tragic 73.8% |
| Immigrants | Uzbekistan | 0.0 /100 | #337 | Tragic 73.4% |
| Inupiat | 0.0 /100 | #338 | Tragic 71.5% |
| Guyanese | 0.0 /100 | #339 | Tragic 70.8% |
| Dominicans | 0.0 /100 | #340 | Tragic 70.7% |
| Immigrants | Barbados | 0.0 /100 | #341 | Tragic 70.6% |
| Immigrants | Guyana | 0.0 /100 | #342 | Tragic 70.6% |
| British West Indians | 0.0 /100 | #343 | Tragic 70.4% |
| Immigrants | Dominican Republic | 0.0 /100 | #344 | Tragic 68.6% |
| Immigrants | St. Vincent and the Grenadines | 0.0 /100 | #345 | Tragic 64.7% |