Pennsylvania German vs Potawatomi 2 or more Vehicles in Household
COMPARE
Pennsylvania German
Potawatomi
2 or more Vehicles in Household
2 or more Vehicles in Household Comparison
Pennsylvania Germans
Potawatomi
58.5%
2 OR MORE VEHICLES IN HOUSEHOLD
99.7/ 100
METRIC RATING
69th/ 347
METRIC RANK
58.0%
2 OR MORE VEHICLES IN HOUSEHOLD
99.1/ 100
METRIC RATING
86th/ 347
METRIC RANK
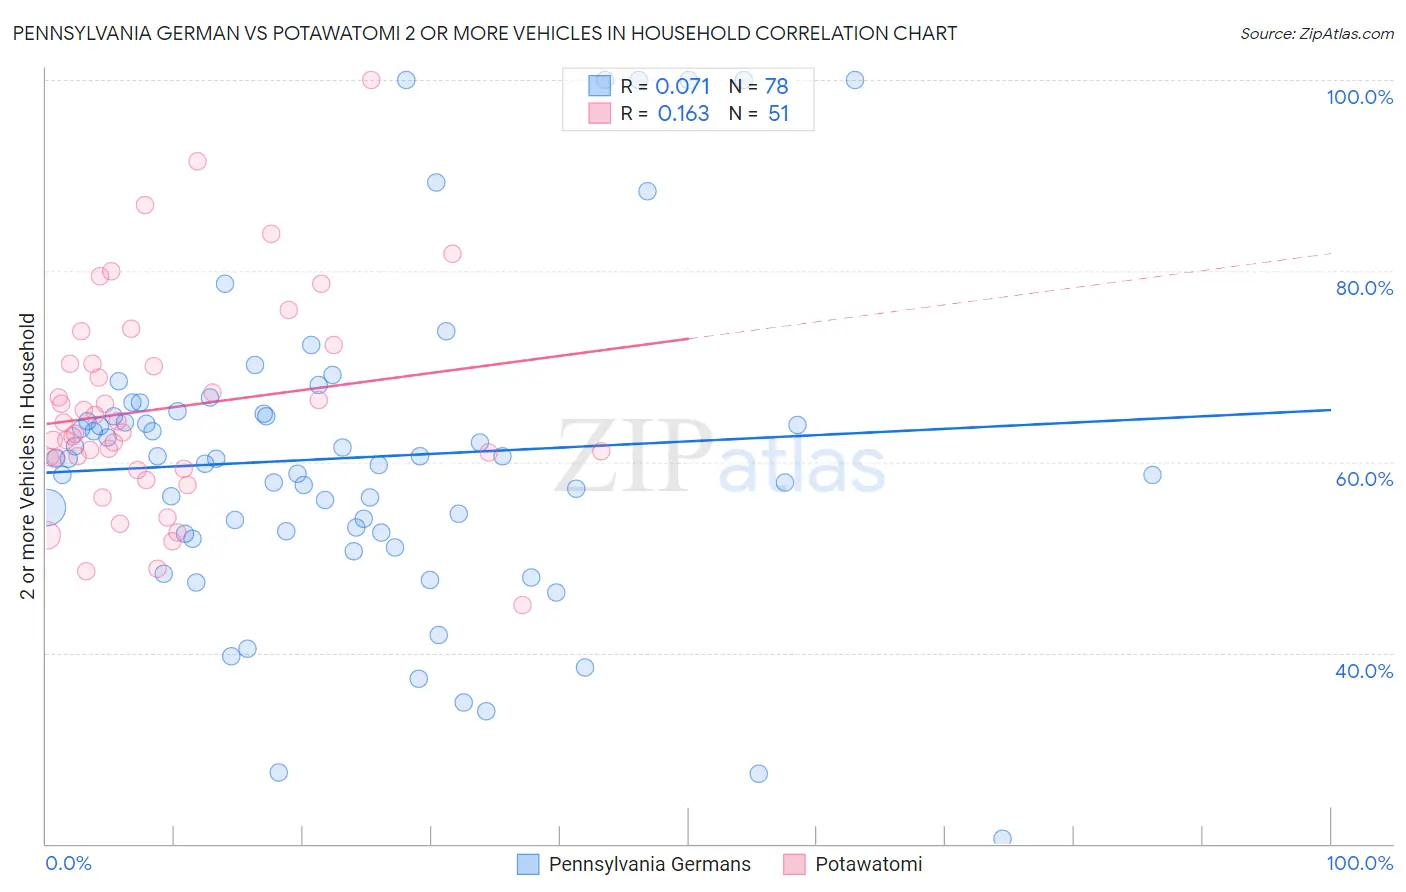
Pennsylvania German vs Potawatomi 2 or more Vehicles in Household Correlation Chart
The statistical analysis conducted on geographies consisting of 234,072,378 people shows a slight positive correlation between the proportion of Pennsylvania Germans and percentage of households with 2 or more vehicles available in the United States with a correlation coefficient (R) of 0.071 and weighted average of 58.5%. Similarly, the statistical analysis conducted on geographies consisting of 117,759,902 people shows a poor positive correlation between the proportion of Potawatomi and percentage of households with 2 or more vehicles available in the United States with a correlation coefficient (R) of 0.163 and weighted average of 58.0%, a difference of 0.94%.
2 or more Vehicles in Household Correlation Summary
| Measurement | Pennsylvania German | Potawatomi |
| Minimum | 20.5% | 45.0% |
| Maximum | 100.0% | 100.0% |
| Range | 79.5% | 55.0% |
| Mean | 60.4% | 65.6% |
| Median | 60.3% | 63.1% |
| Interquartile 25% (IQ1) | 52.6% | 59.2% |
| Interquartile 75% (IQ3) | 65.0% | 70.3% |
| Interquartile Range (IQR) | 12.4% | 11.1% |
| Standard Deviation (Sample) | 16.6% | 11.1% |
| Standard Deviation (Population) | 16.5% | 11.0% |
Demographics Similar to Pennsylvania Germans and Potawatomi by 2 or more Vehicles in Household
In terms of 2 or more vehicles in household, the demographic groups most similar to Pennsylvania Germans are Italian (58.4%, a difference of 0.11%), Canadian (58.6%, a difference of 0.12%), Laotian (58.6%, a difference of 0.13%), Bangladeshi (58.4%, a difference of 0.14%), and Austrian (58.4%, a difference of 0.16%). Similarly, the demographic groups most similar to Potawatomi are Slovak (58.0%, a difference of 0.030%), Thai (57.9%, a difference of 0.040%), Maltese (58.0%, a difference of 0.080%), Icelander (58.0%, a difference of 0.11%), and Iranian (58.1%, a difference of 0.15%).
| Demographics | Rating | Rank | 2 or more Vehicles in Household |
| Laotians | 99.7 /100 | #67 | Exceptional 58.6% |
| Canadians | 99.7 /100 | #68 | Exceptional 58.6% |
| Pennsylvania Germans | 99.7 /100 | #69 | Exceptional 58.5% |
| Italians | 99.6 /100 | #70 | Exceptional 58.4% |
| Bangladeshis | 99.6 /100 | #71 | Exceptional 58.4% |
| Austrians | 99.6 /100 | #72 | Exceptional 58.4% |
| Bolivians | 99.6 /100 | #73 | Exceptional 58.3% |
| Immigrants | Afghanistan | 99.6 /100 | #74 | Exceptional 58.3% |
| Poles | 99.5 /100 | #75 | Exceptional 58.3% |
| Creek | 99.5 /100 | #76 | Exceptional 58.3% |
| Slovenes | 99.5 /100 | #77 | Exceptional 58.3% |
| Lithuanians | 99.5 /100 | #78 | Exceptional 58.2% |
| Delaware | 99.4 /100 | #79 | Exceptional 58.2% |
| Immigrants | England | 99.3 /100 | #80 | Exceptional 58.1% |
| Immigrants | Iraq | 99.3 /100 | #81 | Exceptional 58.1% |
| Iranians | 99.3 /100 | #82 | Exceptional 58.1% |
| Icelanders | 99.2 /100 | #83 | Exceptional 58.0% |
| Maltese | 99.2 /100 | #84 | Exceptional 58.0% |
| Slovaks | 99.2 /100 | #85 | Exceptional 58.0% |
| Potawatomi | 99.1 /100 | #86 | Exceptional 58.0% |
| Thais | 99.1 /100 | #87 | Exceptional 57.9% |