Palestinian vs Irish 12th Grade, No Diploma

COMPARE

Palestinian
Race
Ancestry
AfghanAfricanAlaska NativeAlaskan AthabascanAlbanianAleutAlsatianAmericanApacheArabArapahoArgentineanArmenianAssyrian/Chaldean/SyriacAustralianAustrianBahamianBangladeshiBarbadianBasqueBelgianBelizeanBermudanBhutaneseBlackfeetBolivianBrazilianBritishBritish West IndianBulgarianBurmeseCajunCambodianCanadianCape VerdeanCarpatho RusynCelticCentral AmericanCentral American IndianCherokeeCheyenneChickasawChileanChineseChippewaChoctawColombianColvilleComancheCosta RicanCreeCreekCroatianCrowCubanCypriotCzechCzechoslovakianDanishDelawareDominicanDutchDutch West IndianEastern EuropeanEcuadorianEgyptianEnglishEstonianEthiopianEuropeanFijianFilipinoFinnishFrenchFrench American IndianFrench CanadianGermanGerman RussianGhanaianGreekGuamanian/ChamorroGuatemalanGuyaneseHaitianHmongHonduranHopiHoumaHungarianIcelanderIndian (Asian)IndonesianInupiatIranianIraqiIroquoisIsraeliItalianJamaicanJapaneseJordanianKenyanKiowaKoreanLaotianLatvianLebaneseLiberianLithuanianLumbeeLuxembourgerMacedonianMalaysianMalteseMarshalleseMenomineeMexicanMexican American IndianMongolianMoroccanNative HawaiianNavajoNepaleseNew ZealanderNicaraguanNigerianNorthern EuropeanNorwegianOkinawanOsageOttawaPaiutePakistaniPalestinianPanamanianParaguayanPennsylvania GermanPeruvianPimaPolishPortuguesePotawatomiPuebloPuerto RicanPuget Sound SalishRomanianRussianSalvadoranSamoanScandinavianScotch-IrishScottishSeminoleSenegaleseSerbianShoshoneSierra LeoneanSiouxSlavicSlovakSloveneSomaliSouth AfricanSouth AmericanSouth American IndianSoviet UnionSpaniardSpanishSpanish AmericanSpanish American IndianSri LankanSubsaharan AfricanSudaneseSwedishSwissSyrianTaiwaneseThaiTlingit-HaidaTohono O'OdhamTonganTrinidadian and TobagonianTsimshianTurkishU.S. Virgin IslanderUgandanUkrainianUruguayanUteVenezuelanVietnameseWelshWest IndianYakamaYaquiYugoslavianYumanYup'ikZimbabwean
Immigration
NonimmigrantsImmigrantsAfghanistanAfricaAlbaniaArgentinaArmeniaAsiaAustraliaAustriaBahamasBangladeshBarbadosBelarusBelgiumBelizeBoliviaBosnia and HerzegovinaBrazilBulgariaBurma/MyanmarCabo VerdeCambodiaCameroonCanadaCaribbeanCentral AmericaChileChinaColombiaCongoCosta RicaCroatiaCubaCzechoslovakiaDenmarkDominicaDominican RepublicEastern AfricaEastern AsiaEastern EuropeEcuadorEgyptEl SalvadorEnglandEritreaEthiopiaEuropeFijiFranceGermanyGhanaGreeceGrenadaGuatemalaGuyanaHaitiHondurasHong KongHungaryIndiaIndonesiaIranIraqIrelandIsraelItalyJamaicaJapanJordanKazakhstanKenyaKoreaKuwaitLaosLatin AmericaLatviaLebanonLiberiaLithuaniaMalaysiaMexicoMicronesiaMiddle AfricaMoldovaMoroccoNepalNetherlandsNicaraguaNigeriaNorth AmericaNorth MacedoniaNorthern AfricaNorthern EuropeNorwayOceaniaPakistanPanamaPeruPhilippinesPolandPortugalRomaniaRussiaSaudi ArabiaScotlandSenegalSerbiaSierra LeoneSingaporeSomaliaSouth AfricaSouth AmericaSouth Central AsiaSouth Eastern AsiaSouthern EuropeSpainSri LankaSt. Vincent and the GrenadinesSudanSwedenSwitzerlandSyriaTaiwanThailandTrinidad and TobagoTurkeyUgandaUkraineUruguayUzbekistanVenezuelaVietnamWest IndiesWestern AfricaWestern AsiaWestern EuropeYemenZaireZimbabweAzores
Irish
Race
Ancestry
AfghanAfricanAlaska NativeAlaskan AthabascanAlbanianAleutAlsatianAmericanApacheArabArapahoArgentineanArmenianAssyrian/Chaldean/SyriacAustralianAustrianBahamianBangladeshiBarbadianBasqueBelgianBelizeanBermudanBhutaneseBlackfeetBolivianBrazilianBritishBritish West IndianBulgarianBurmeseCajunCambodianCanadianCape VerdeanCarpatho RusynCelticCentral AmericanCentral American IndianCherokeeCheyenneChickasawChileanChineseChippewaChoctawColombianColvilleComancheCosta RicanCreeCreekCroatianCrowCubanCypriotCzechCzechoslovakianDanishDelawareDominicanDutchDutch West IndianEastern EuropeanEcuadorianEgyptianEnglishEstonianEthiopianEuropeanFijianFilipinoFinnishFrenchFrench American IndianFrench CanadianGermanGerman RussianGhanaianGreekGuamanian/ChamorroGuatemalanGuyaneseHaitianHmongHonduranHopiHoumaHungarianIcelanderIndian (Asian)IndonesianInupiatIranianIraqiIrishIroquoisIsraeliItalianJamaicanJapaneseJordanianKenyanKiowaKoreanLaotianLatvianLebaneseLiberianLithuanianLumbeeLuxembourgerMacedonianMalaysianMalteseMarshalleseMenomineeMexicanMexican American IndianMongolianMoroccanNative HawaiianNavajoNepaleseNew ZealanderNicaraguanNigerianNorthern EuropeanNorwegianOkinawanOsageOttawaPaiutePakistaniPanamanianParaguayanPennsylvania GermanPeruvianPimaPolishPortuguesePotawatomiPuebloPuerto RicanPuget Sound SalishRomanianRussianSalvadoranSamoanScandinavianScotch-IrishScottishSeminoleSenegaleseSerbianShoshoneSierra LeoneanSiouxSlavicSlovakSloveneSomaliSouth AfricanSouth AmericanSouth American IndianSoviet UnionSpaniardSpanishSpanish AmericanSpanish American IndianSri LankanSubsaharan AfricanSudaneseSwedishSwissSyrianTaiwaneseThaiTlingit-HaidaTohono O'OdhamTonganTrinidadian and TobagonianTsimshianTurkishU.S. Virgin IslanderUgandanUkrainianUruguayanUteVenezuelanVietnameseWelshWest IndianYakamaYaquiYugoslavianYumanYup'ikZimbabwean
Immigration
NonimmigrantsImmigrantsAfghanistanAfricaAlbaniaArgentinaArmeniaAsiaAustraliaAustriaBahamasBangladeshBarbadosBelarusBelgiumBelizeBoliviaBosnia and HerzegovinaBrazilBulgariaBurma/MyanmarCabo VerdeCambodiaCameroonCanadaCaribbeanCentral AmericaChileChinaColombiaCongoCosta RicaCroatiaCubaCzechoslovakiaDenmarkDominicaDominican RepublicEastern AfricaEastern AsiaEastern EuropeEcuadorEgyptEl SalvadorEnglandEritreaEthiopiaEuropeFijiFranceGermanyGhanaGreeceGrenadaGuatemalaGuyanaHaitiHondurasHong KongHungaryIndiaIndonesiaIranIraqIrelandIsraelItalyJamaicaJapanJordanKazakhstanKenyaKoreaKuwaitLaosLatin AmericaLatviaLebanonLiberiaLithuaniaMalaysiaMexicoMicronesiaMiddle AfricaMoldovaMoroccoNepalNetherlandsNicaraguaNigeriaNorth AmericaNorth MacedoniaNorthern AfricaNorthern EuropeNorwayOceaniaPakistanPanamaPeruPhilippinesPolandPortugalRomaniaRussiaSaudi ArabiaScotlandSenegalSerbiaSierra LeoneSingaporeSomaliaSouth AfricaSouth AmericaSouth Central AsiaSouth Eastern AsiaSouthern EuropeSpainSri LankaSt. Vincent and the GrenadinesSudanSwedenSwitzerlandSyriaTaiwanThailandTrinidad and TobagoTurkeyUgandaUkraineUruguayUzbekistanVenezuelaVietnamWest IndiesWestern AfricaWestern AsiaWestern EuropeYemenZaireZimbabweAzores
12th Grade, No Diploma
Income
Poverty
Unemployment
Labor Participation
Family Structure
Vehicle Availability
Education Level
Disability

12th Grade, No Diploma Comparison

Palestinians

Irish

Exceptional
Exceptional
92.1%
12TH GRADE, NO DIPLOMA
97.0/ 100
METRIC RATING
110th/ 347
METRIC RANK
93.0%
12TH GRADE, NO DIPLOMA
99.9/ 100
METRIC RATING
37th/ 347
METRIC RANK

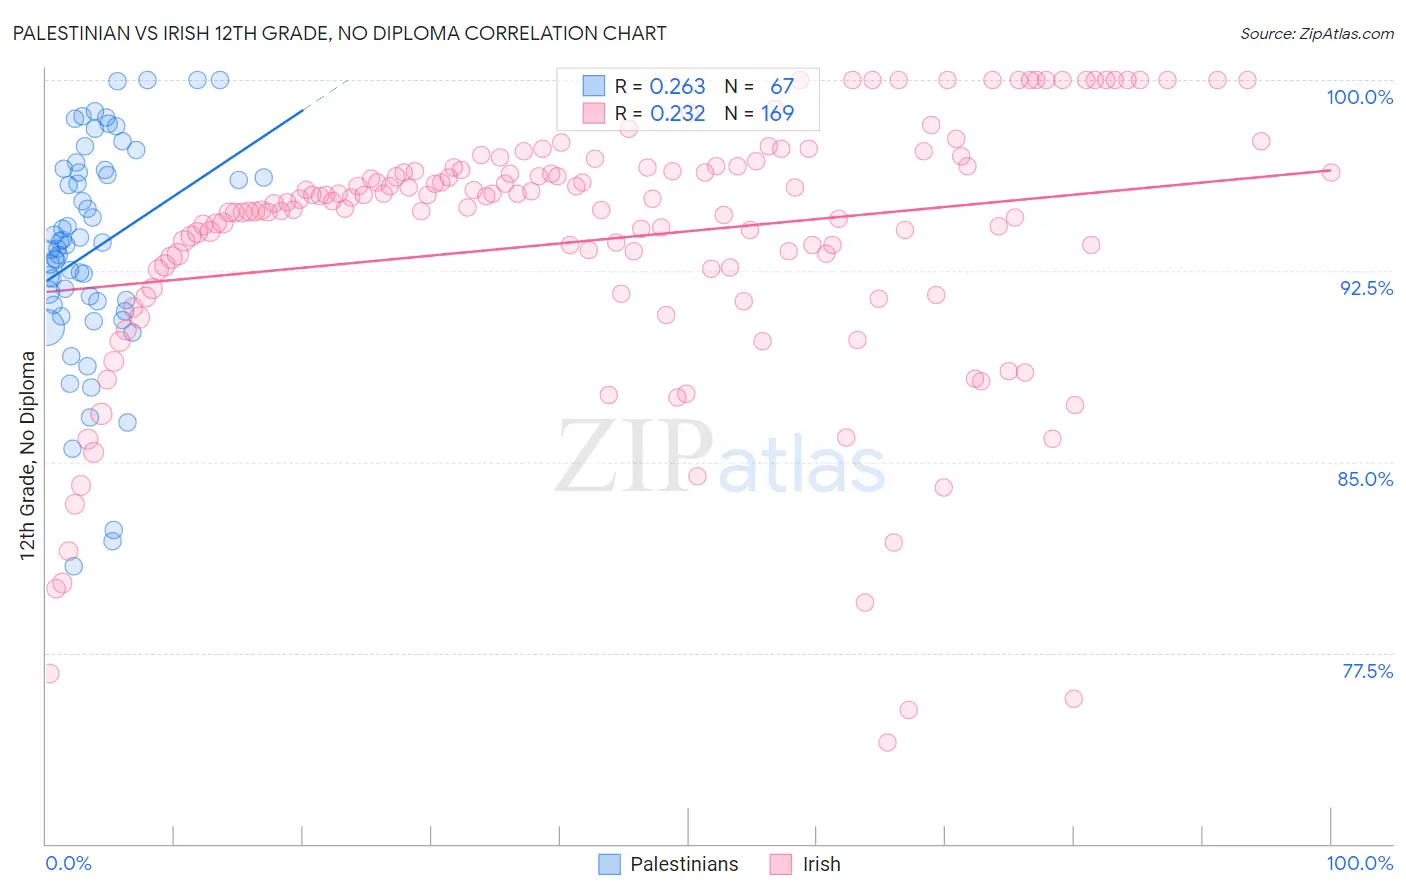
Palestinian vs Irish 12th Grade, No Diploma Correlation Chart

The statistical analysis conducted on geographies consisting of 216,461,770 people shows a weak positive correlation between the proportion of Palestinians and percentage of population with at least 12th grade (no diploma) education in the United States with a correlation coefficient (R) of 0.263 and weighted average of 92.1%. Similarly, the statistical analysis conducted on geographies consisting of 580,710,123 people shows a weak positive correlation between the proportion of Irish and percentage of population with at least 12th grade (no diploma) education in the United States with a correlation coefficient (R) of 0.232 and weighted average of 93.0%, a difference of 0.93%.
Palestinian vs Irish 12th Grade, No Diploma

12th Grade, No Diploma Correlation Summary

MeasurementPalestinianIrish
Minimum80.9%74.0%
Maximum100.0%100.0%
Range19.1%26.0%
Mean93.3%93.7%
Median93.5%95.1%
Interquartile 25% (IQ1)91.2%92.6%
Interquartile 75% (IQ3)96.5%96.6%
Interquartile Range (IQR)5.3%4.0%
Standard Deviation (Sample)4.3%5.3%
Standard Deviation (Population)4.3%5.2%

Similar Demographics by 12th Grade, No Diploma

Demographics Similar to Palestinians by 12th Grade, No Diploma

In terms of 12th grade, no diploma, the demographic groups most similar to Palestinians are Immigrants from Hungary (92.1%, a difference of 0.0%), Immigrants from Greece (92.1%, a difference of 0.010%), Jordanian (92.2%, a difference of 0.020%), Israeli (92.1%, a difference of 0.020%), and Syrian (92.2%, a difference of 0.030%).
DemographicsRating | Rank12th Grade, No Diploma
Immigrants | Norway
98.1
/100
|
#103
Exceptional
92.3%
Lebanese
97.6
/100
|
#104
Exceptional
92.2%
Immigrants | Belarus
97.4
/100
|
#105
Exceptional
92.2%
Immigrants | Russia
97.3
/100
|
#106
Exceptional
92.2%
Syrians
97.2
/100
|
#107
Exceptional
92.2%
Jordanians
97.2
/100
|
#108
Exceptional
92.2%
Immigrants | Hungary
97.0
/100
|
#109
Exceptional
92.1%
Palestinians
97.0
/100
|
#110
Exceptional
92.1%
Immigrants | Greece
96.9
/100
|
#111
Exceptional
92.1%
Israelis
96.8
/100
|
#112
Exceptional
92.1%
Immigrants | Zimbabwe
96.5
/100
|
#113
Exceptional
92.1%
Yugoslavians
96.5
/100
|
#114
Exceptional
92.1%
Immigrants | Sri Lanka
96.4
/100
|
#115
Exceptional
92.1%
Aleuts
96.3
/100
|
#116
Exceptional
92.1%
Immigrants | Eastern Europe
96.3
/100
|
#117
Exceptional
92.1%

Demographics Similar to Irish by 12th Grade, No Diploma

In terms of 12th grade, no diploma, the demographic groups most similar to Irish are Scottish (93.0%, a difference of 0.0%), Okinawan (93.0%, a difference of 0.010%), English (93.0%, a difference of 0.010%), Immigrants from Scotland (93.0%, a difference of 0.030%), and Tlingit-Haida (93.0%, a difference of 0.030%).
DemographicsRating | Rank12th Grade, No Diploma
Immigrants | Lithuania
99.9
/100
|
#30
Exceptional
93.1%
Immigrants | Ireland
99.9
/100
|
#31
Exceptional
93.1%
Europeans
99.9
/100
|
#32
Exceptional
93.1%
Immigrants | Scotland
99.9
/100
|
#33
Exceptional
93.0%
Okinawans
99.9
/100
|
#34
Exceptional
93.0%
English
99.9
/100
|
#35
Exceptional
93.0%
Scottish
99.9
/100
|
#36
Exceptional
93.0%
Irish
99.9
/100
|
#37
Exceptional
93.0%
Tlingit-Haida
99.8
/100
|
#38
Exceptional
93.0%
Immigrants | Austria
99.8
/100
|
#39
Exceptional
93.0%
Turks
99.8
/100
|
#40
Exceptional
93.0%
Bhutanese
99.8
/100
|
#41
Exceptional
93.0%
Immigrants | Australia
99.8
/100
|
#42
Exceptional
92.9%
Northern Europeans
99.8
/100
|
#43
Exceptional
92.9%
Dutch
99.8
/100
|
#44
Exceptional
92.9%