Palestinian vs Immigrants from Eritrea Unemployment Among Youth under 25 years
COMPARE
Palestinian
Immigrants from Eritrea
Unemployment Among Youth under 25 years
Unemployment Among Youth under 25 years Comparison
Palestinians
Immigrants from Eritrea
11.8%
UNEMPLOYMENT AMONG YOUTH UNDER 25 YEARS
16.0/ 100
METRIC RATING
201st/ 347
METRIC RANK
11.1%
UNEMPLOYMENT AMONG YOUTH UNDER 25 YEARS
98.8/ 100
METRIC RATING
57th/ 347
METRIC RANK
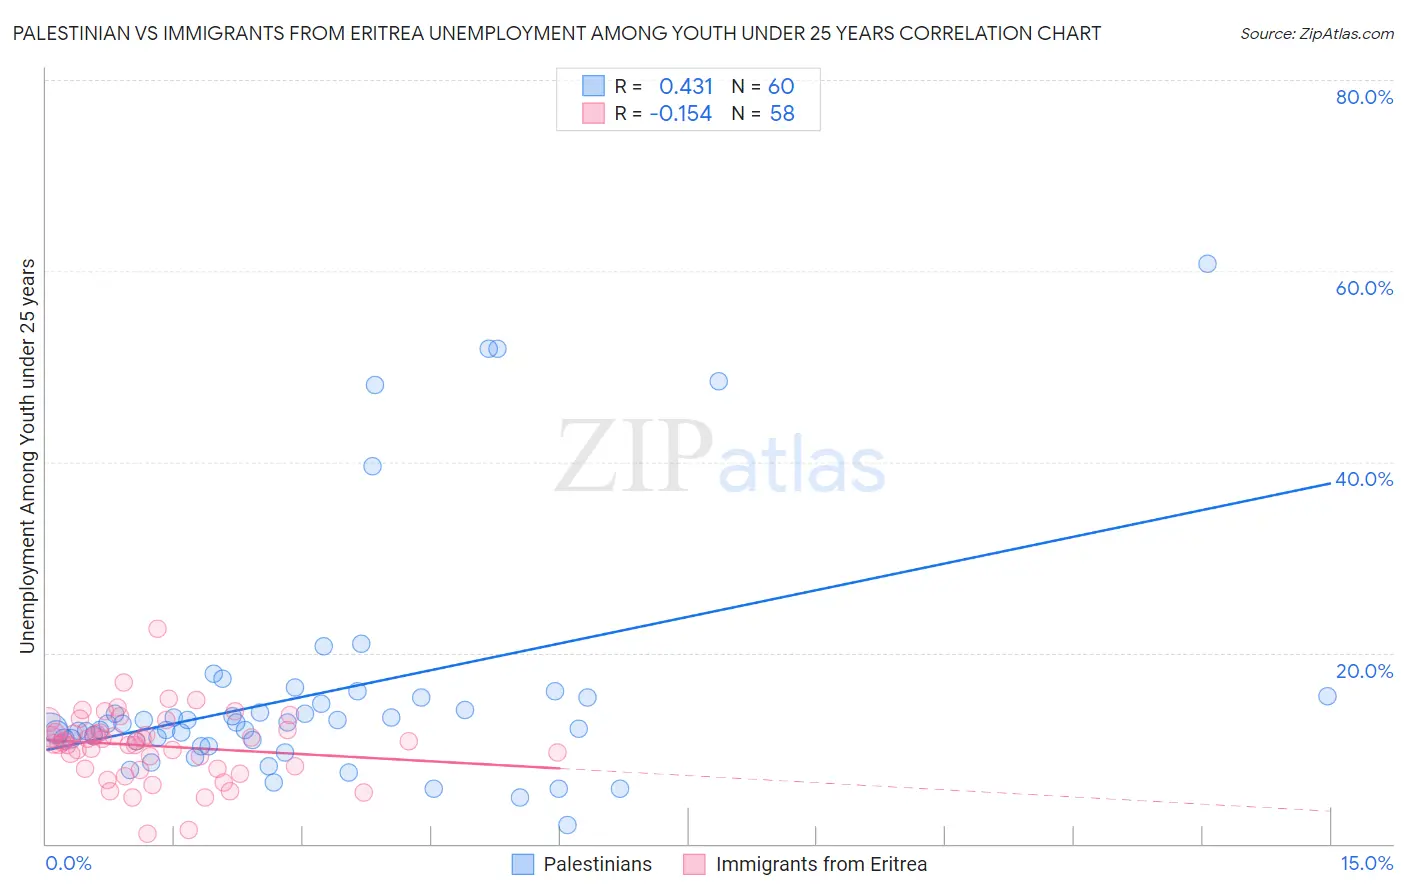
Palestinian vs Immigrants from Eritrea Unemployment Among Youth under 25 years Correlation Chart
The statistical analysis conducted on geographies consisting of 215,804,460 people shows a moderate positive correlation between the proportion of Palestinians and unemployment rate among youth under the age of 25 in the United States with a correlation coefficient (R) of 0.431 and weighted average of 11.8%. Similarly, the statistical analysis conducted on geographies consisting of 104,703,473 people shows a poor negative correlation between the proportion of Immigrants from Eritrea and unemployment rate among youth under the age of 25 in the United States with a correlation coefficient (R) of -0.154 and weighted average of 11.1%, a difference of 6.6%.
Unemployment Among Youth under 25 years Correlation Summary
| Measurement | Palestinian | Immigrants from Eritrea |
| Minimum | 2.0% | 1.0% |
| Maximum | 60.7% | 22.5% |
| Range | 58.7% | 21.5% |
| Mean | 15.7% | 10.2% |
| Median | 12.6% | 10.7% |
| Interquartile 25% (IQ1) | 10.8% | 7.9% |
| Interquartile 75% (IQ3) | 15.3% | 11.7% |
| Interquartile Range (IQR) | 4.5% | 3.8% |
| Standard Deviation (Sample) | 12.2% | 3.6% |
| Standard Deviation (Population) | 12.1% | 3.6% |
Similar Demographics by Unemployment Among Youth under 25 years
Demographics Similar to Palestinians by Unemployment Among Youth under 25 years
In terms of unemployment among youth under 25 years, the demographic groups most similar to Palestinians are Marshallese (11.8%, a difference of 0.020%), Immigrants from Peru (11.8%, a difference of 0.050%), Immigrants from Costa Rica (11.8%, a difference of 0.060%), Arab (11.8%, a difference of 0.15%), and Peruvian (11.8%, a difference of 0.16%).
| Demographics | Rating | Rank | Unemployment Among Youth under 25 years |
| Immigrants | Sri Lanka | 27.8 /100 | #194 | Fair 11.7% |
| Paraguayans | 27.2 /100 | #195 | Fair 11.7% |
| Egyptians | 26.9 /100 | #196 | Fair 11.7% |
| Koreans | 23.9 /100 | #197 | Fair 11.7% |
| Cherokee | 21.2 /100 | #198 | Fair 11.8% |
| Immigrants | Colombia | 20.9 /100 | #199 | Fair 11.8% |
| Arabs | 18.0 /100 | #200 | Poor 11.8% |
| Palestinians | 16.0 /100 | #201 | Poor 11.8% |
| Marshallese | 15.8 /100 | #202 | Poor 11.8% |
| Immigrants | Peru | 15.3 /100 | #203 | Poor 11.8% |
| Immigrants | Costa Rica | 15.2 /100 | #204 | Poor 11.8% |
| Peruvians | 14.0 /100 | #205 | Poor 11.8% |
| Immigrants | Pakistan | 12.6 /100 | #206 | Poor 11.8% |
| Immigrants | Southern Europe | 12.3 /100 | #207 | Poor 11.8% |
| Comanche | 12.1 /100 | #208 | Poor 11.8% |
Demographics Similar to Immigrants from Eritrea by Unemployment Among Youth under 25 years
In terms of unemployment among youth under 25 years, the demographic groups most similar to Immigrants from Eritrea are Immigrants from Saudi Arabia (11.1%, a difference of 0.010%), Mongolian (11.1%, a difference of 0.030%), Irish (11.1%, a difference of 0.030%), Scotch-Irish (11.1%, a difference of 0.040%), and Immigrants from Eastern Africa (11.1%, a difference of 0.10%).
| Demographics | Rating | Rank | Unemployment Among Youth under 25 years |
| Czechoslovakians | 99.2 /100 | #50 | Exceptional 11.0% |
| Serbians | 99.0 /100 | #51 | Exceptional 11.0% |
| Latvians | 99.0 /100 | #52 | Exceptional 11.0% |
| Ottawa | 99.0 /100 | #53 | Exceptional 11.1% |
| Mongolians | 98.9 /100 | #54 | Exceptional 11.1% |
| Irish | 98.9 /100 | #55 | Exceptional 11.1% |
| Immigrants | Saudi Arabia | 98.8 /100 | #56 | Exceptional 11.1% |
| Immigrants | Eritrea | 98.8 /100 | #57 | Exceptional 11.1% |
| Scotch-Irish | 98.8 /100 | #58 | Exceptional 11.1% |
| Immigrants | Eastern Africa | 98.7 /100 | #59 | Exceptional 11.1% |
| South Africans | 98.5 /100 | #60 | Exceptional 11.1% |
| Filipinos | 98.3 /100 | #61 | Exceptional 11.1% |
| Immigrants | Netherlands | 98.1 /100 | #62 | Exceptional 11.1% |
| Immigrants | Croatia | 98.1 /100 | #63 | Exceptional 11.1% |
| Jordanians | 97.9 /100 | #64 | Exceptional 11.1% |