Ottawa vs Northern European Unemployment Among Women with Children Under 6 years
COMPARE
Ottawa
Northern European
Unemployment Among Women with Children Under 6 years
Unemployment Among Women with Children Under 6 years Comparison
Ottawa
Northern Europeans
9.9%
UNEMPLOYMENT AMONG WOMEN WITH CHILDREN UNDER 6 YEARS
0.0/ 100
METRIC RATING
327th/ 347
METRIC RANK
7.5%
UNEMPLOYMENT AMONG WOMEN WITH CHILDREN UNDER 6 YEARS
74.3/ 100
METRIC RATING
154th/ 347
METRIC RANK
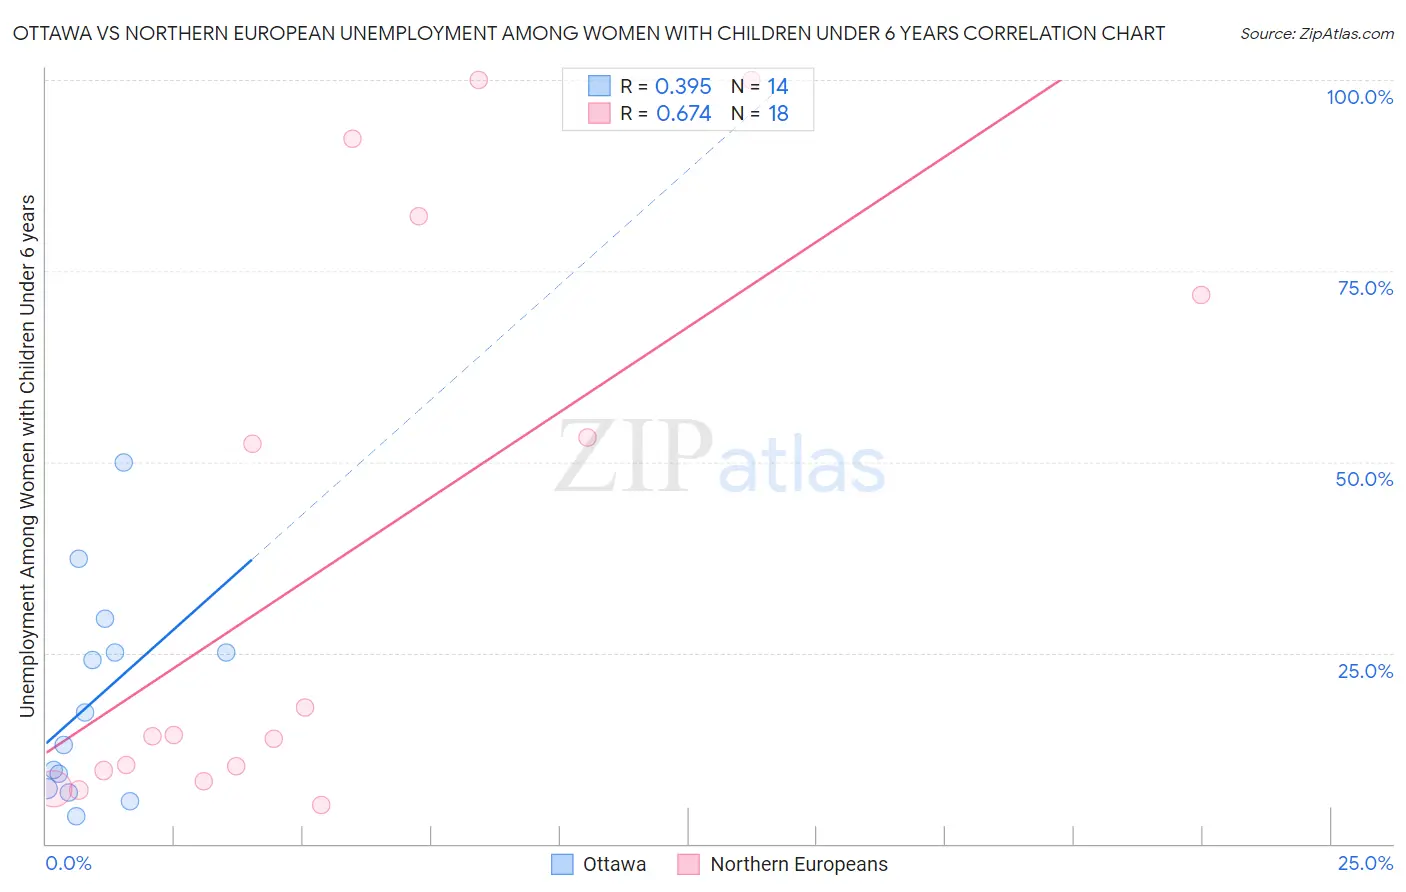
Ottawa vs Northern European Unemployment Among Women with Children Under 6 years Correlation Chart
The statistical analysis conducted on geographies consisting of 44,780,729 people shows a mild positive correlation between the proportion of Ottawa and unemployment rate among women with children under the age of 6 in the United States with a correlation coefficient (R) of 0.395 and weighted average of 9.9%. Similarly, the statistical analysis conducted on geographies consisting of 297,166,845 people shows a significant positive correlation between the proportion of Northern Europeans and unemployment rate among women with children under the age of 6 in the United States with a correlation coefficient (R) of 0.674 and weighted average of 7.5%, a difference of 31.4%.
Unemployment Among Women with Children Under 6 years Correlation Summary
| Measurement | Ottawa | Northern European |
| Minimum | 3.6% | 5.1% |
| Maximum | 50.0% | 100.0% |
| Range | 46.4% | 94.9% |
| Mean | 18.8% | 37.2% |
| Median | 15.1% | 14.2% |
| Interquartile 25% (IQ1) | 7.2% | 9.6% |
| Interquartile 75% (IQ3) | 25.1% | 71.9% |
| Interquartile Range (IQR) | 17.9% | 62.3% |
| Standard Deviation (Sample) | 13.7% | 36.4% |
| Standard Deviation (Population) | 13.2% | 35.4% |
Similar Demographics by Unemployment Among Women with Children Under 6 years
Demographics Similar to Ottawa by Unemployment Among Women with Children Under 6 years
In terms of unemployment among women with children under 6 years, the demographic groups most similar to Ottawa are Delaware (9.8%, a difference of 0.80%), Choctaw (9.8%, a difference of 0.83%), Paiute (9.7%, a difference of 1.8%), Immigrants from Bahamas (9.6%, a difference of 2.5%), and Alaska Native (9.6%, a difference of 2.7%).
| Demographics | Rating | Rank | Unemployment Among Women with Children Under 6 years |
| Potawatomi | 0.0 /100 | #320 | Tragic 9.6% |
| Central American Indians | 0.0 /100 | #321 | Tragic 9.6% |
| Alaska Natives | 0.0 /100 | #322 | Tragic 9.6% |
| Immigrants | Bahamas | 0.0 /100 | #323 | Tragic 9.6% |
| Paiute | 0.0 /100 | #324 | Tragic 9.7% |
| Choctaw | 0.0 /100 | #325 | Tragic 9.8% |
| Delaware | 0.0 /100 | #326 | Tragic 9.8% |
| Ottawa | 0.0 /100 | #327 | Tragic 9.9% |
| Tohono O'odham | 0.0 /100 | #328 | Tragic 10.2% |
| Blacks/African Americans | 0.0 /100 | #329 | Tragic 10.3% |
| Pennsylvania Germans | 0.0 /100 | #330 | Tragic 10.8% |
| Colville | 0.0 /100 | #331 | Tragic 11.2% |
| Sioux | 0.0 /100 | #332 | Tragic 11.5% |
| Natives/Alaskans | 0.0 /100 | #333 | Tragic 11.5% |
| Apache | 0.0 /100 | #334 | Tragic 12.3% |
Demographics Similar to Northern Europeans by Unemployment Among Women with Children Under 6 years
In terms of unemployment among women with children under 6 years, the demographic groups most similar to Northern Europeans are South American (7.5%, a difference of 0.020%), Uruguayan (7.5%, a difference of 0.030%), Bangladeshi (7.5%, a difference of 0.040%), Immigrants from Peru (7.5%, a difference of 0.050%), and Immigrants from Southern Europe (7.5%, a difference of 0.10%).
| Demographics | Rating | Rank | Unemployment Among Women with Children Under 6 years |
| Immigrants | Oceania | 78.4 /100 | #147 | Good 7.5% |
| Immigrants | Brazil | 77.3 /100 | #148 | Good 7.5% |
| Colombians | 76.1 /100 | #149 | Good 7.5% |
| Aleuts | 76.0 /100 | #150 | Good 7.5% |
| Immigrants | Peru | 74.9 /100 | #151 | Good 7.5% |
| Bangladeshis | 74.8 /100 | #152 | Good 7.5% |
| Uruguayans | 74.7 /100 | #153 | Good 7.5% |
| Northern Europeans | 74.3 /100 | #154 | Good 7.5% |
| South Americans | 74.1 /100 | #155 | Good 7.5% |
| Immigrants | Southern Europe | 73.2 /100 | #156 | Good 7.5% |
| Peruvians | 72.3 /100 | #157 | Good 7.5% |
| Croatians | 71.9 /100 | #158 | Good 7.5% |
| Immigrants | Philippines | 71.3 /100 | #159 | Good 7.5% |
| Bolivians | 70.8 /100 | #160 | Good 7.5% |
| Immigrants | Western Asia | 70.2 /100 | #161 | Good 7.5% |