Ottawa vs Immigrants from Guatemala 2 or more Vehicles in Household
COMPARE
Ottawa
Immigrants from Guatemala
2 or more Vehicles in Household
2 or more Vehicles in Household Comparison
Ottawa
Immigrants from Guatemala
57.9%
2 OR MORE VEHICLES IN HOUSEHOLD
99.0/ 100
METRIC RATING
93rd/ 347
METRIC RANK
53.5%
2 OR MORE VEHICLES IN HOUSEHOLD
3.2/ 100
METRIC RATING
232nd/ 347
METRIC RANK
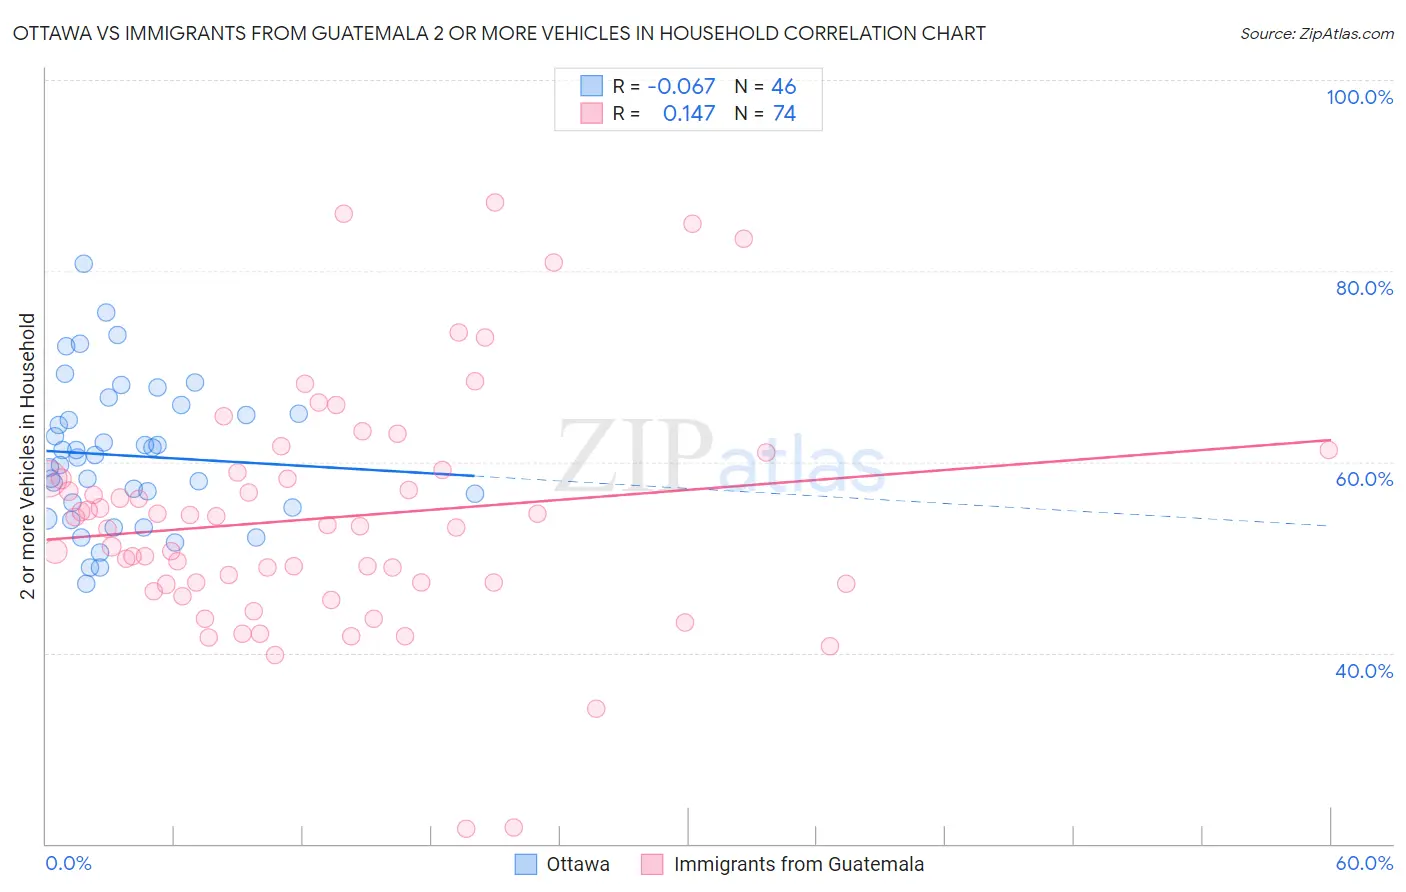
Ottawa vs Immigrants from Guatemala 2 or more Vehicles in Household Correlation Chart
The statistical analysis conducted on geographies consisting of 49,944,336 people shows a slight negative correlation between the proportion of Ottawa and percentage of households with 2 or more vehicles available in the United States with a correlation coefficient (R) of -0.067 and weighted average of 57.9%. Similarly, the statistical analysis conducted on geographies consisting of 377,175,695 people shows a poor positive correlation between the proportion of Immigrants from Guatemala and percentage of households with 2 or more vehicles available in the United States with a correlation coefficient (R) of 0.147 and weighted average of 53.5%, a difference of 8.2%.
2 or more Vehicles in Household Correlation Summary
| Measurement | Ottawa | Immigrants from Guatemala |
| Minimum | 47.2% | 21.5% |
| Maximum | 80.8% | 87.2% |
| Range | 33.5% | 65.7% |
| Mean | 60.7% | 54.1% |
| Median | 60.6% | 53.3% |
| Interquartile 25% (IQ1) | 55.3% | 47.2% |
| Interquartile 75% (IQ3) | 65.0% | 58.9% |
| Interquartile Range (IQR) | 9.7% | 11.7% |
| Standard Deviation (Sample) | 7.5% | 12.5% |
| Standard Deviation (Population) | 7.4% | 12.4% |
Similar Demographics by 2 or more Vehicles in Household
Demographics Similar to Ottawa by 2 or more Vehicles in Household
In terms of 2 or more vehicles in household, the demographic groups most similar to Ottawa are Shoshone (57.9%, a difference of 0.0%), Pakistani (57.9%, a difference of 0.030%), Immigrants from Germany (57.9%, a difference of 0.060%), Hispanic or Latino (57.9%, a difference of 0.060%), and Filipino (57.8%, a difference of 0.060%).
| Demographics | Rating | Rank | 2 or more Vehicles in Household |
| Potawatomi | 99.1 /100 | #86 | Exceptional 58.0% |
| Thais | 99.1 /100 | #87 | Exceptional 57.9% |
| Immigrants | Iran | 99.1 /100 | #88 | Exceptional 57.9% |
| Immigrants | Germany | 99.0 /100 | #89 | Exceptional 57.9% |
| Hispanics or Latinos | 99.0 /100 | #90 | Exceptional 57.9% |
| Pakistanis | 99.0 /100 | #91 | Exceptional 57.9% |
| Shoshone | 99.0 /100 | #92 | Exceptional 57.9% |
| Ottawa | 99.0 /100 | #93 | Exceptional 57.9% |
| Filipinos | 98.9 /100 | #94 | Exceptional 57.8% |
| Hmong | 98.9 /100 | #95 | Exceptional 57.8% |
| Burmese | 98.8 /100 | #96 | Exceptional 57.8% |
| Slavs | 98.8 /100 | #97 | Exceptional 57.8% |
| Palestinians | 98.6 /100 | #98 | Exceptional 57.7% |
| Cajuns | 98.5 /100 | #99 | Exceptional 57.7% |
| Fijians | 98.4 /100 | #100 | Exceptional 57.6% |
Demographics Similar to Immigrants from Guatemala by 2 or more Vehicles in Household
In terms of 2 or more vehicles in household, the demographic groups most similar to Immigrants from Guatemala are Ugandan (53.5%, a difference of 0.010%), Immigrants from Switzerland (53.4%, a difference of 0.060%), Panamanian (53.5%, a difference of 0.070%), Immigrants from Middle Africa (53.4%, a difference of 0.090%), and Immigrants from Nepal (53.5%, a difference of 0.12%).
| Demographics | Rating | Rank | 2 or more Vehicles in Household |
| Immigrants | Egypt | 5.2 /100 | #225 | Tragic 53.8% |
| Immigrants | Eastern Africa | 5.1 /100 | #226 | Tragic 53.7% |
| Sudanese | 4.1 /100 | #227 | Tragic 53.6% |
| Alaska Natives | 3.9 /100 | #228 | Tragic 53.6% |
| Immigrants | Turkey | 3.8 /100 | #229 | Tragic 53.6% |
| Immigrants | Nepal | 3.6 /100 | #230 | Tragic 53.5% |
| Panamanians | 3.4 /100 | #231 | Tragic 53.5% |
| Immigrants | Guatemala | 3.2 /100 | #232 | Tragic 53.5% |
| Ugandans | 3.2 /100 | #233 | Tragic 53.5% |
| Immigrants | Switzerland | 3.0 /100 | #234 | Tragic 53.4% |
| Immigrants | Middle Africa | 3.0 /100 | #235 | Tragic 53.4% |
| Indonesians | 2.7 /100 | #236 | Tragic 53.4% |
| Macedonians | 2.4 /100 | #237 | Tragic 53.3% |
| Immigrants | Armenia | 2.3 /100 | #238 | Tragic 53.3% |
| Cambodians | 2.3 /100 | #239 | Tragic 53.3% |