Crow vs Salvadoran 4 or more Vehicles in Household
COMPARE
Crow
Salvadoran
4 or more Vehicles in Household
4 or more Vehicles in Household Comparison
Crow
Salvadorans
7.8%
4 OR MORE VEHICLES IN HOUSEHOLD
100.0/ 100
METRIC RATING
46th/ 347
METRIC RANK
7.8%
4 OR MORE VEHICLES IN HOUSEHOLD
100.0/ 100
METRIC RATING
42nd/ 347
METRIC RANK
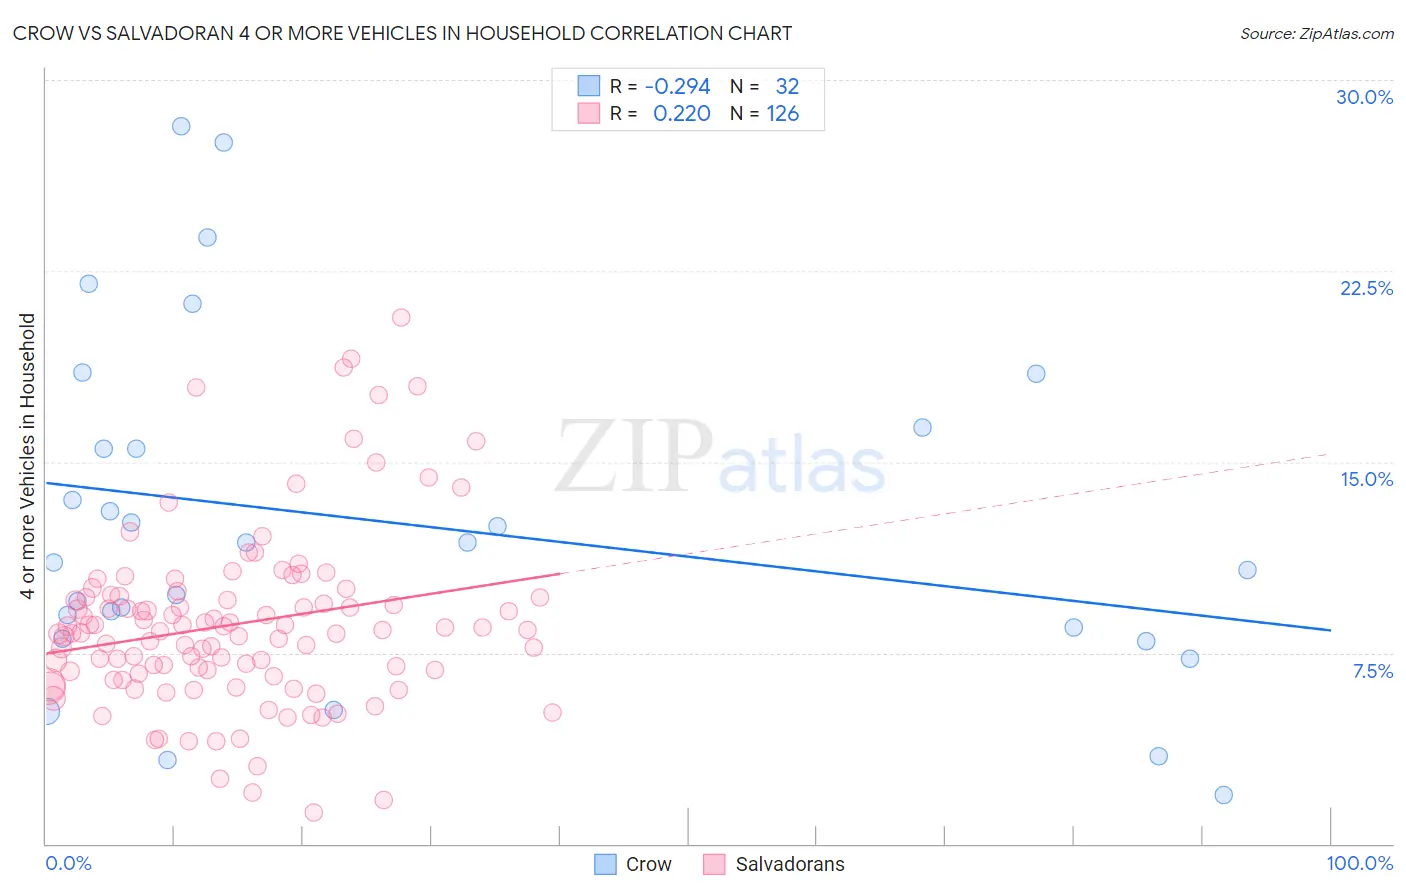
Crow vs Salvadoran 4 or more Vehicles in Household Correlation Chart
The statistical analysis conducted on geographies consisting of 59,198,453 people shows a weak negative correlation between the proportion of Crow and percentage of households with 4 or more vehicles available in the United States with a correlation coefficient (R) of -0.294 and weighted average of 7.8%. Similarly, the statistical analysis conducted on geographies consisting of 397,203,446 people shows a weak positive correlation between the proportion of Salvadorans and percentage of households with 4 or more vehicles available in the United States with a correlation coefficient (R) of 0.220 and weighted average of 7.8%, a difference of 0.60%.
4 or more Vehicles in Household Correlation Summary
| Measurement | Crow | Salvadoran |
| Minimum | 1.9% | 1.2% |
| Maximum | 28.2% | 20.7% |
| Range | 26.3% | 19.4% |
| Mean | 12.6% | 8.6% |
| Median | 11.4% | 8.4% |
| Interquartile 25% (IQ1) | 8.3% | 6.7% |
| Interquartile 75% (IQ3) | 15.9% | 9.7% |
| Interquartile Range (IQR) | 7.7% | 3.0% |
| Standard Deviation (Sample) | 6.7% | 3.5% |
| Standard Deviation (Population) | 6.6% | 3.5% |
Demographics Similar to Crow and Salvadorans by 4 or more Vehicles in Household
In terms of 4 or more vehicles in household, the demographic groups most similar to Crow are Osage (7.8%, a difference of 0.16%), Choctaw (7.8%, a difference of 0.17%), Bhutanese (7.8%, a difference of 0.22%), Swiss (7.8%, a difference of 0.34%), and Fijian (7.8%, a difference of 0.49%). Similarly, the demographic groups most similar to Salvadorans are Fijian (7.8%, a difference of 0.11%), Bhutanese (7.8%, a difference of 0.38%), Choctaw (7.8%, a difference of 0.43%), Pima (7.9%, a difference of 0.49%), and Osage (7.8%, a difference of 0.76%).
| Demographics | Rating | Rank | 4 or more Vehicles in Household |
| Alaskan Athabascans | 100.0 /100 | #34 | Exceptional 8.1% |
| Guamanians/Chamorros | 100.0 /100 | #35 | Exceptional 8.1% |
| Norwegians | 100.0 /100 | #36 | Exceptional 8.0% |
| Scandinavians | 100.0 /100 | #37 | Exceptional 8.0% |
| Sioux | 100.0 /100 | #38 | Exceptional 8.0% |
| Spanish Americans | 100.0 /100 | #39 | Exceptional 8.0% |
| Spanish | 100.0 /100 | #40 | Exceptional 7.9% |
| Pima | 100.0 /100 | #41 | Exceptional 7.9% |
| Salvadorans | 100.0 /100 | #42 | Exceptional 7.8% |
| Fijians | 100.0 /100 | #43 | Exceptional 7.8% |
| Bhutanese | 100.0 /100 | #44 | Exceptional 7.8% |
| Choctaw | 100.0 /100 | #45 | Exceptional 7.8% |
| Crow | 100.0 /100 | #46 | Exceptional 7.8% |
| Osage | 100.0 /100 | #47 | Exceptional 7.8% |
| Swiss | 100.0 /100 | #48 | Exceptional 7.8% |
| Cherokee | 100.0 /100 | #49 | Exceptional 7.7% |
| Immigrants | El Salvador | 100.0 /100 | #50 | Exceptional 7.7% |
| Immigrants | Laos | 100.0 /100 | #51 | Exceptional 7.7% |
| Japanese | 100.0 /100 | #52 | Exceptional 7.7% |
| Malaysians | 100.0 /100 | #53 | Exceptional 7.7% |
| Dutch | 100.0 /100 | #54 | Exceptional 7.7% |