Moroccan vs Immigrants from Scotland Unemployment Among Ages 35 to 44 years

COMPARE

Moroccan
Race
Ancestry
AfghanAfricanAlaska NativeAlaskan AthabascanAlbanianAleutAlsatianAmericanApacheArabArapahoArgentineanArmenianAssyrian/Chaldean/SyriacAustralianAustrianBahamianBangladeshiBarbadianBasqueBelgianBelizeanBermudanBhutaneseBlackfeetBolivianBrazilianBritishBritish West IndianBulgarianBurmeseCajunCambodianCanadianCape VerdeanCarpatho RusynCelticCentral AmericanCentral American IndianCherokeeCheyenneChickasawChileanChineseChippewaChoctawColombianColvilleComancheCosta RicanCreeCreekCroatianCrowCubanCypriotCzechCzechoslovakianDanishDelawareDominicanDutchDutch West IndianEastern EuropeanEcuadorianEgyptianEnglishEstonianEthiopianEuropeanFijianFilipinoFinnishFrenchFrench American IndianFrench CanadianGermanGerman RussianGhanaianGreekGuamanian/ChamorroGuatemalanGuyaneseHaitianHmongHonduranHopiHoumaHungarianIcelanderIndian (Asian)IndonesianInupiatIranianIraqiIrishIroquoisIsraeliItalianJamaicanJapaneseJordanianKenyanKiowaKoreanLaotianLatvianLebaneseLiberianLithuanianLumbeeLuxembourgerMacedonianMalaysianMalteseMarshalleseMenomineeMexicanMexican American IndianMongolianMoroccanNative HawaiianNavajoNepaleseNew ZealanderNicaraguanNigerianNorthern EuropeanNorwegianOkinawanOsageOttawaPaiutePakistaniPalestinianPanamanianParaguayanPennsylvania GermanPeruvianPimaPolishPortuguesePotawatomiPuebloPuerto RicanPuget Sound SalishRomanianRussianSalvadoranSamoanScandinavianScotch-IrishScottishSeminoleSenegaleseSerbianShoshoneSierra LeoneanSiouxSlavicSlovakSloveneSomaliSouth AfricanSouth AmericanSouth American IndianSoviet UnionSpaniardSpanishSpanish AmericanSpanish American IndianSri LankanSubsaharan AfricanSudaneseSwedishSwissSyrianTaiwaneseThaiTlingit-HaidaTohono O'OdhamTonganTrinidadian and TobagonianTsimshianTurkishU.S. Virgin IslanderUgandanUkrainianUruguayanUteVenezuelanVietnameseWelshWest IndianYakamaYaquiYugoslavianYumanYup'ikZimbabwean
Immigration
NonimmigrantsImmigrantsAfghanistanAfricaAlbaniaArgentinaArmeniaAsiaAustraliaAustriaBahamasBangladeshBarbadosBelarusBelgiumBelizeBoliviaBosnia and HerzegovinaBrazilBulgariaBurma/MyanmarCabo VerdeCambodiaCameroonCanadaCaribbeanCentral AmericaChileChinaColombiaCongoCosta RicaCroatiaCubaCzechoslovakiaDenmarkDominicaDominican RepublicEastern AfricaEastern AsiaEastern EuropeEcuadorEgyptEl SalvadorEnglandEritreaEthiopiaEuropeFijiFranceGermanyGhanaGreeceGrenadaGuatemalaGuyanaHaitiHondurasHong KongHungaryIndiaIndonesiaIranIraqIrelandIsraelItalyJamaicaJapanJordanKazakhstanKenyaKoreaKuwaitLaosLatin AmericaLatviaLebanonLiberiaLithuaniaMalaysiaMexicoMicronesiaMiddle AfricaMoldovaMoroccoNepalNetherlandsNicaraguaNigeriaNorth AmericaNorth MacedoniaNorthern AfricaNorthern EuropeNorwayOceaniaPakistanPanamaPeruPhilippinesPolandPortugalRomaniaRussiaSaudi ArabiaSenegalSerbiaSierra LeoneSingaporeSomaliaSouth AfricaSouth AmericaSouth Central AsiaSouth Eastern AsiaSouthern EuropeSpainSri LankaSt. Vincent and the GrenadinesSudanSwedenSwitzerlandSyriaTaiwanThailandTrinidad and TobagoTurkeyUgandaUkraineUruguayUzbekistanVenezuelaVietnamWest IndiesWestern AfricaWestern AsiaWestern EuropeYemenZaireZimbabweAzores
Immigrants from Scotland
Race
Ancestry
AfghanAfricanAlaska NativeAlaskan AthabascanAlbanianAleutAlsatianAmericanApacheArabArapahoArgentineanArmenianAssyrian/Chaldean/SyriacAustralianAustrianBahamianBangladeshiBarbadianBasqueBelgianBelizeanBermudanBhutaneseBlackfeetBolivianBrazilianBritishBritish West IndianBulgarianBurmeseCajunCambodianCanadianCape VerdeanCarpatho RusynCelticCentral AmericanCentral American IndianCherokeeCheyenneChickasawChileanChineseChippewaChoctawColombianColvilleComancheCosta RicanCreeCreekCroatianCrowCubanCypriotCzechCzechoslovakianDanishDelawareDominicanDutchDutch West IndianEastern EuropeanEcuadorianEgyptianEnglishEstonianEthiopianEuropeanFijianFilipinoFinnishFrenchFrench American IndianFrench CanadianGermanGerman RussianGhanaianGreekGuamanian/ChamorroGuatemalanGuyaneseHaitianHmongHonduranHopiHoumaHungarianIcelanderIndian (Asian)IndonesianInupiatIranianIraqiIrishIroquoisIsraeliItalianJamaicanJapaneseJordanianKenyanKiowaKoreanLaotianLatvianLebaneseLiberianLithuanianLumbeeLuxembourgerMacedonianMalaysianMalteseMarshalleseMenomineeMexicanMexican American IndianMongolianNative HawaiianNavajoNepaleseNew ZealanderNicaraguanNigerianNorthern EuropeanNorwegianOkinawanOsageOttawaPaiutePakistaniPalestinianPanamanianParaguayanPennsylvania GermanPeruvianPimaPolishPortuguesePotawatomiPuebloPuerto RicanPuget Sound SalishRomanianRussianSalvadoranSamoanScandinavianScotch-IrishScottishSeminoleSenegaleseSerbianShoshoneSierra LeoneanSiouxSlavicSlovakSloveneSomaliSouth AfricanSouth AmericanSouth American IndianSoviet UnionSpaniardSpanishSpanish AmericanSpanish American IndianSri LankanSubsaharan AfricanSudaneseSwedishSwissSyrianTaiwaneseThaiTlingit-HaidaTohono O'OdhamTonganTrinidadian and TobagonianTsimshianTurkishU.S. Virgin IslanderUgandanUkrainianUruguayanUteVenezuelanVietnameseWelshWest IndianYakamaYaquiYugoslavianYumanYup'ikZimbabwean
Immigration
NonimmigrantsImmigrantsAfghanistanAfricaAlbaniaArgentinaArmeniaAsiaAustraliaAustriaBahamasBangladeshBarbadosBelarusBelgiumBelizeBoliviaBosnia and HerzegovinaBrazilBulgariaBurma/MyanmarCabo VerdeCambodiaCameroonCanadaCaribbeanCentral AmericaChileChinaColombiaCongoCosta RicaCroatiaCubaCzechoslovakiaDenmarkDominicaDominican RepublicEastern AfricaEastern AsiaEastern EuropeEcuadorEgyptEl SalvadorEnglandEritreaEthiopiaEuropeFijiFranceGermanyGhanaGreeceGrenadaGuatemalaGuyanaHaitiHondurasHong KongHungaryIndiaIndonesiaIranIraqIrelandIsraelItalyJamaicaJapanJordanKazakhstanKenyaKoreaKuwaitLaosLatin AmericaLatviaLebanonLiberiaLithuaniaMalaysiaMexicoMicronesiaMiddle AfricaMoldovaMoroccoNepalNetherlandsNicaraguaNigeriaNorth AmericaNorth MacedoniaNorthern AfricaNorthern EuropeNorwayOceaniaPakistanPanamaPeruPhilippinesPolandPortugalRomaniaRussiaSaudi ArabiaScotlandSenegalSerbiaSierra LeoneSingaporeSomaliaSouth AfricaSouth AmericaSouth Central AsiaSouth Eastern AsiaSouthern EuropeSpainSri LankaSt. Vincent and the GrenadinesSudanSwedenSwitzerlandSyriaTaiwanThailandTrinidad and TobagoTurkeyUgandaUkraineUruguayUzbekistanVenezuelaVietnamWest IndiesWestern AfricaWestern AsiaWestern EuropeYemenZaireZimbabweAzores
Unemployment Among Ages 35 to 44 years
Income
Poverty
Unemployment
Labor Participation
Family Structure
Vehicle Availability
Education Level
Disability

Unemployment Among Ages 35 to 44 years Comparison

Moroccans

Immigrants from Scotland

Tragic
Exceptional
4.9%
UNEMPLOYMENT AMONG AGES 35 TO 44 YEARS
6.0/ 100
METRIC RATING
217th/ 347
METRIC RANK
4.4%
UNEMPLOYMENT AMONG AGES 35 TO 44 YEARS
95.6/ 100
METRIC RATING
81st/ 347
METRIC RANK

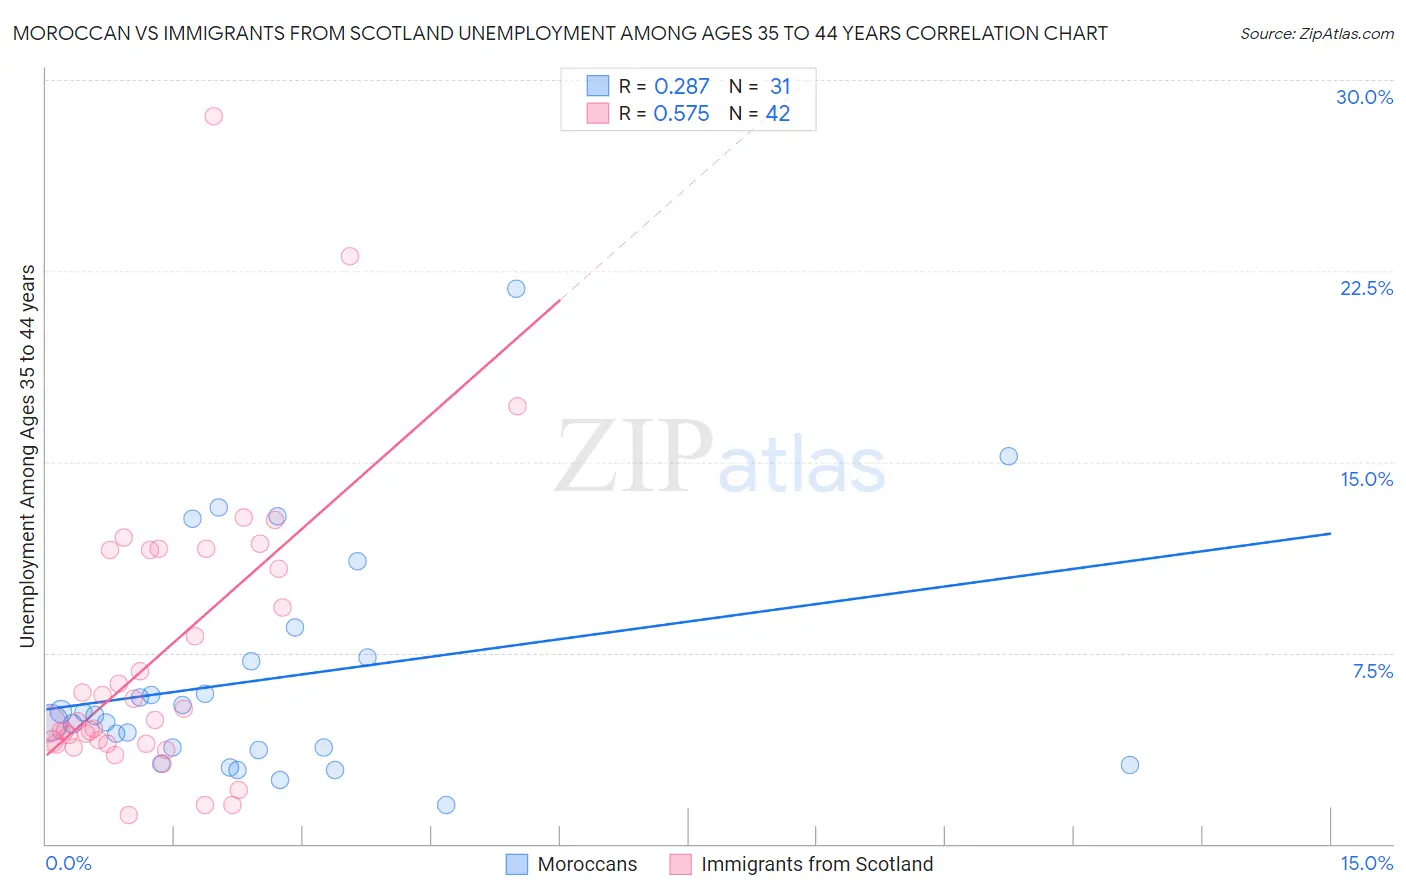
Moroccan vs Immigrants from Scotland Unemployment Among Ages 35 to 44 years Correlation Chart

The statistical analysis conducted on geographies consisting of 200,434,316 people shows a weak positive correlation between the proportion of Moroccans and unemployment rate among population between the ages 35 and 44 in the United States with a correlation coefficient (R) of 0.287 and weighted average of 4.9%. Similarly, the statistical analysis conducted on geographies consisting of 193,761,745 people shows a substantial positive correlation between the proportion of Immigrants from Scotland and unemployment rate among population between the ages 35 and 44 in the United States with a correlation coefficient (R) of 0.575 and weighted average of 4.4%, a difference of 10.9%.
Moroccan vs Immigrants from Scotland Unemployment Among Ages 35 to 44 years

Unemployment Among Ages 35 to 44 years Correlation Summary

MeasurementMoroccanImmigrants from Scotland
Minimum1.5%1.1%
Maximum21.8%28.6%
Range20.3%27.5%
Mean6.5%7.4%
Median5.0%4.8%
Interquartile 25% (IQ1)3.7%4.0%
Interquartile 75% (IQ3)7.3%11.5%
Interquartile Range (IQR)3.6%7.6%
Standard Deviation (Sample)4.5%5.7%
Standard Deviation (Population)4.4%5.6%

Similar Demographics by Unemployment Among Ages 35 to 44 years

Demographics Similar to Moroccans by Unemployment Among Ages 35 to 44 years

In terms of unemployment among ages 35 to 44 years, the demographic groups most similar to Moroccans are American (4.9%, a difference of 0.040%), Chickasaw (4.9%, a difference of 0.11%), Sierra Leonean (4.9%, a difference of 0.42%), Immigrants from Sierra Leone (4.9%, a difference of 0.45%), and Immigrants (4.9%, a difference of 0.51%).
DemographicsRating | RankUnemployment Among Ages 35 to 44 years
Immigrants | Cameroon
11.4
/100
|
#210
Poor
4.9%
Immigrants | Nonimmigrants
9.4
/100
|
#211
Tragic
4.9%
Fijians
8.7
/100
|
#212
Tragic
4.9%
Osage
8.6
/100
|
#213
Tragic
4.9%
Immigrants | Africa
8.2
/100
|
#214
Tragic
4.9%
Immigrants | Immigrants
8.0
/100
|
#215
Tragic
4.9%
Americans
6.2
/100
|
#216
Tragic
4.9%
Moroccans
6.0
/100
|
#217
Tragic
4.9%
Chickasaw
5.7
/100
|
#218
Tragic
4.9%
Sierra Leoneans
4.8
/100
|
#219
Tragic
4.9%
Immigrants | Sierra Leone
4.7
/100
|
#220
Tragic
4.9%
Bermudans
3.9
/100
|
#221
Tragic
5.0%
Hmong
3.5
/100
|
#222
Tragic
5.0%
Immigrants | Panama
3.3
/100
|
#223
Tragic
5.0%
Panamanians
2.9
/100
|
#224
Tragic
5.0%

Demographics Similar to Immigrants from Scotland by Unemployment Among Ages 35 to 44 years

In terms of unemployment among ages 35 to 44 years, the demographic groups most similar to Immigrants from Scotland are Immigrants from Asia (4.4%, a difference of 0.010%), Kenyan (4.4%, a difference of 0.050%), Immigrants from Sweden (4.4%, a difference of 0.12%), Immigrants from Australia (4.4%, a difference of 0.14%), and Indian (Asian) (4.4%, a difference of 0.17%).
DemographicsRating | RankUnemployment Among Ages 35 to 44 years
Poles
96.4
/100
|
#74
Exceptional
4.4%
Immigrants | Romania
96.3
/100
|
#75
Exceptional
4.4%
Immigrants | Jordan
96.3
/100
|
#76
Exceptional
4.4%
Dutch
96.1
/100
|
#77
Exceptional
4.4%
Indians (Asian)
96.0
/100
|
#78
Exceptional
4.4%
Immigrants | Sweden
95.9
/100
|
#79
Exceptional
4.4%
Kenyans
95.7
/100
|
#80
Exceptional
4.4%
Immigrants | Scotland
95.6
/100
|
#81
Exceptional
4.4%
Immigrants | Asia
95.6
/100
|
#82
Exceptional
4.4%
Immigrants | Australia
95.3
/100
|
#83
Exceptional
4.4%
Immigrants | Chile
95.2
/100
|
#84
Exceptional
4.4%
Immigrants | Kenya
95.0
/100
|
#85
Exceptional
4.4%
Serbians
94.9
/100
|
#86
Exceptional
4.4%
Immigrants | Bosnia and Herzegovina
94.8
/100
|
#87
Exceptional
4.4%
Immigrants | Latvia
94.8
/100
|
#88
Exceptional
4.4%