Lumbee vs Immigrants from Egypt 10th Grade
COMPARE
Lumbee
Immigrants from Egypt
10th Grade
10th Grade Comparison
Lumbee
Immigrants from Egypt
91.7%
10TH GRADE
0.0/ 100
METRIC RATING
295th/ 347
METRIC RANK
93.8%
10TH GRADE
62.3/ 100
METRIC RATING
167th/ 347
METRIC RANK
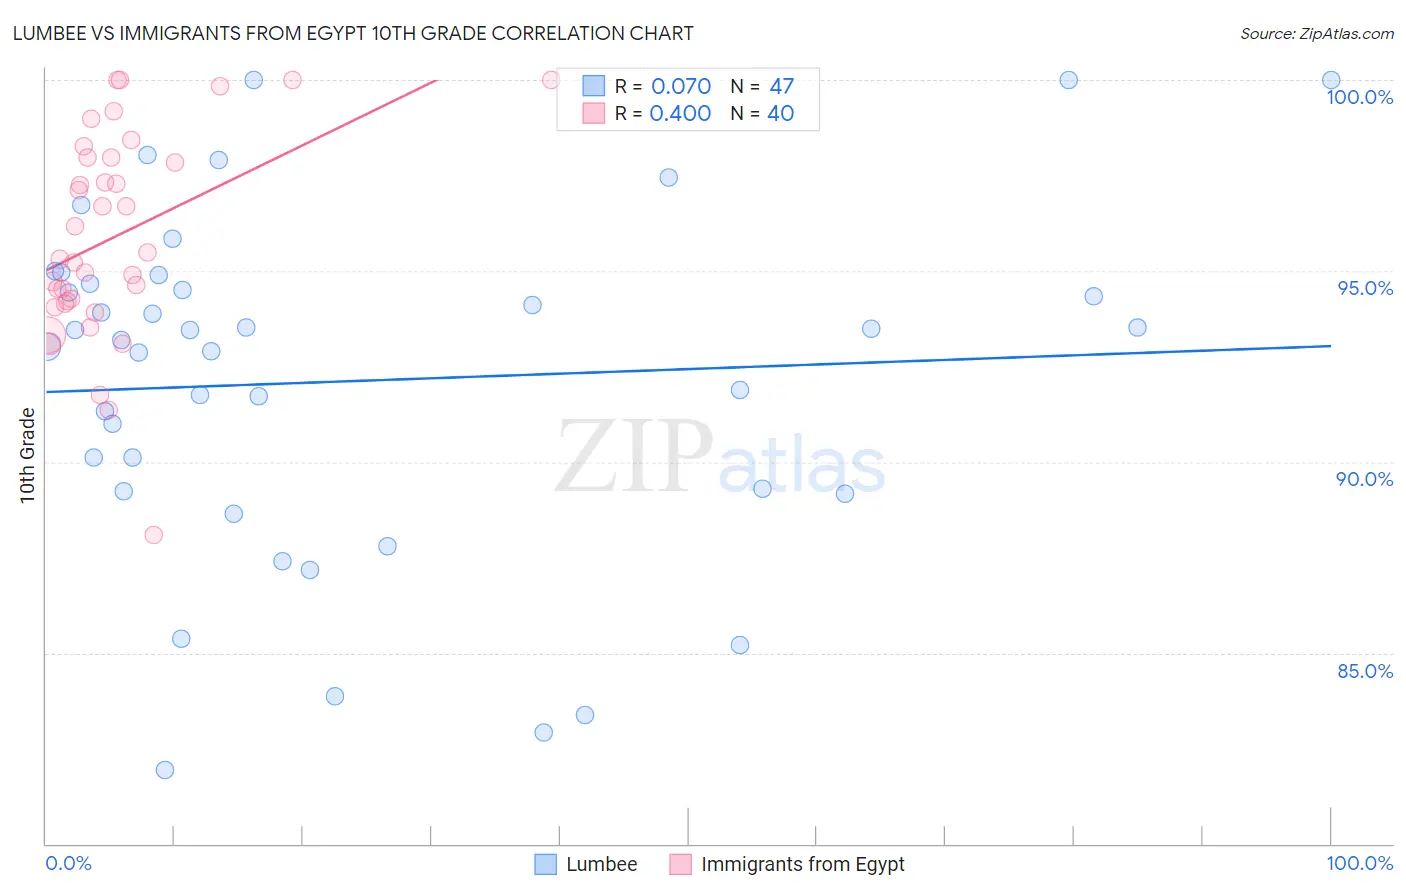
Lumbee vs Immigrants from Egypt 10th Grade Correlation Chart
The statistical analysis conducted on geographies consisting of 92,299,110 people shows a slight positive correlation between the proportion of Lumbee and percentage of population with at least 10th grade education in the United States with a correlation coefficient (R) of 0.070 and weighted average of 91.7%. Similarly, the statistical analysis conducted on geographies consisting of 245,484,455 people shows a mild positive correlation between the proportion of Immigrants from Egypt and percentage of population with at least 10th grade education in the United States with a correlation coefficient (R) of 0.400 and weighted average of 93.8%, a difference of 2.3%.
10th Grade Correlation Summary
| Measurement | Lumbee | Immigrants from Egypt |
| Minimum | 81.9% | 88.1% |
| Maximum | 100.0% | 100.0% |
| Range | 18.1% | 11.9% |
| Mean | 92.1% | 95.9% |
| Median | 93.2% | 95.4% |
| Interquartile 25% (IQ1) | 89.2% | 94.2% |
| Interquartile 75% (IQ3) | 94.7% | 98.0% |
| Interquartile Range (IQR) | 5.4% | 3.8% |
| Standard Deviation (Sample) | 4.5% | 2.7% |
| Standard Deviation (Population) | 4.4% | 2.7% |
Similar Demographics by 10th Grade
Demographics Similar to Lumbee by 10th Grade
In terms of 10th grade, the demographic groups most similar to Lumbee are Haitian (91.8%, a difference of 0.030%), Indonesian (91.8%, a difference of 0.060%), Immigrants from West Indies (91.8%, a difference of 0.080%), Immigrants from Burma/Myanmar (91.8%, a difference of 0.080%), and British West Indian (91.8%, a difference of 0.090%).
| Demographics | Rating | Rank | 10th Grade |
| Immigrants | Laos | 0.0 /100 | #288 | Tragic 91.9% |
| Sri Lankans | 0.0 /100 | #289 | Tragic 91.8% |
| British West Indians | 0.0 /100 | #290 | Tragic 91.8% |
| Immigrants | West Indies | 0.0 /100 | #291 | Tragic 91.8% |
| Immigrants | Burma/Myanmar | 0.0 /100 | #292 | Tragic 91.8% |
| Indonesians | 0.0 /100 | #293 | Tragic 91.8% |
| Haitians | 0.0 /100 | #294 | Tragic 91.8% |
| Lumbee | 0.0 /100 | #295 | Tragic 91.7% |
| Immigrants | Grenada | 0.0 /100 | #296 | Tragic 91.6% |
| Fijians | 0.0 /100 | #297 | Tragic 91.5% |
| Cubans | 0.0 /100 | #298 | Tragic 91.5% |
| Immigrants | Haiti | 0.0 /100 | #299 | Tragic 91.4% |
| Guyanese | 0.0 /100 | #300 | Tragic 91.4% |
| Japanese | 0.0 /100 | #301 | Tragic 91.2% |
| Immigrants | Guyana | 0.0 /100 | #302 | Tragic 91.2% |
Demographics Similar to Immigrants from Egypt by 10th Grade
In terms of 10th grade, the demographic groups most similar to Immigrants from Egypt are Brazilian (93.8%, a difference of 0.010%), Immigrants from Iraq (93.8%, a difference of 0.010%), Alsatian (93.8%, a difference of 0.030%), Iraqi (93.9%, a difference of 0.060%), and Immigrants from Spain (93.8%, a difference of 0.060%).
| Demographics | Rating | Rank | 10th Grade |
| Pakistanis | 70.1 /100 | #160 | Good 93.9% |
| Assyrians/Chaldeans/Syriacs | 69.7 /100 | #161 | Good 93.9% |
| Immigrants | Poland | 69.6 /100 | #162 | Good 93.9% |
| Venezuelans | 69.5 /100 | #163 | Good 93.9% |
| Iraqis | 68.1 /100 | #164 | Good 93.9% |
| Brazilians | 63.6 /100 | #165 | Good 93.8% |
| Immigrants | Iraq | 63.0 /100 | #166 | Good 93.8% |
| Immigrants | Egypt | 62.3 /100 | #167 | Good 93.8% |
| Alsatians | 59.4 /100 | #168 | Average 93.8% |
| Immigrants | Spain | 55.9 /100 | #169 | Average 93.8% |
| Immigrants | Venezuela | 53.9 /100 | #170 | Average 93.8% |
| Immigrants | Albania | 52.4 /100 | #171 | Average 93.8% |
| French American Indians | 50.9 /100 | #172 | Average 93.7% |
| Spaniards | 50.3 /100 | #173 | Average 93.7% |
| Argentineans | 50.0 /100 | #174 | Average 93.7% |