Lumbee vs Samoan No Vehicles in Household
COMPARE
Lumbee
Samoan
No Vehicles in Household
No Vehicles in Household Comparison
Lumbee
Samoans
10.3%
NO VEHICLES IN HOUSEHOLD
54.7/ 100
METRIC RATING
169th/ 347
METRIC RANK
7.6%
NO VEHICLES IN HOUSEHOLD
100.0/ 100
METRIC RATING
28th/ 347
METRIC RANK
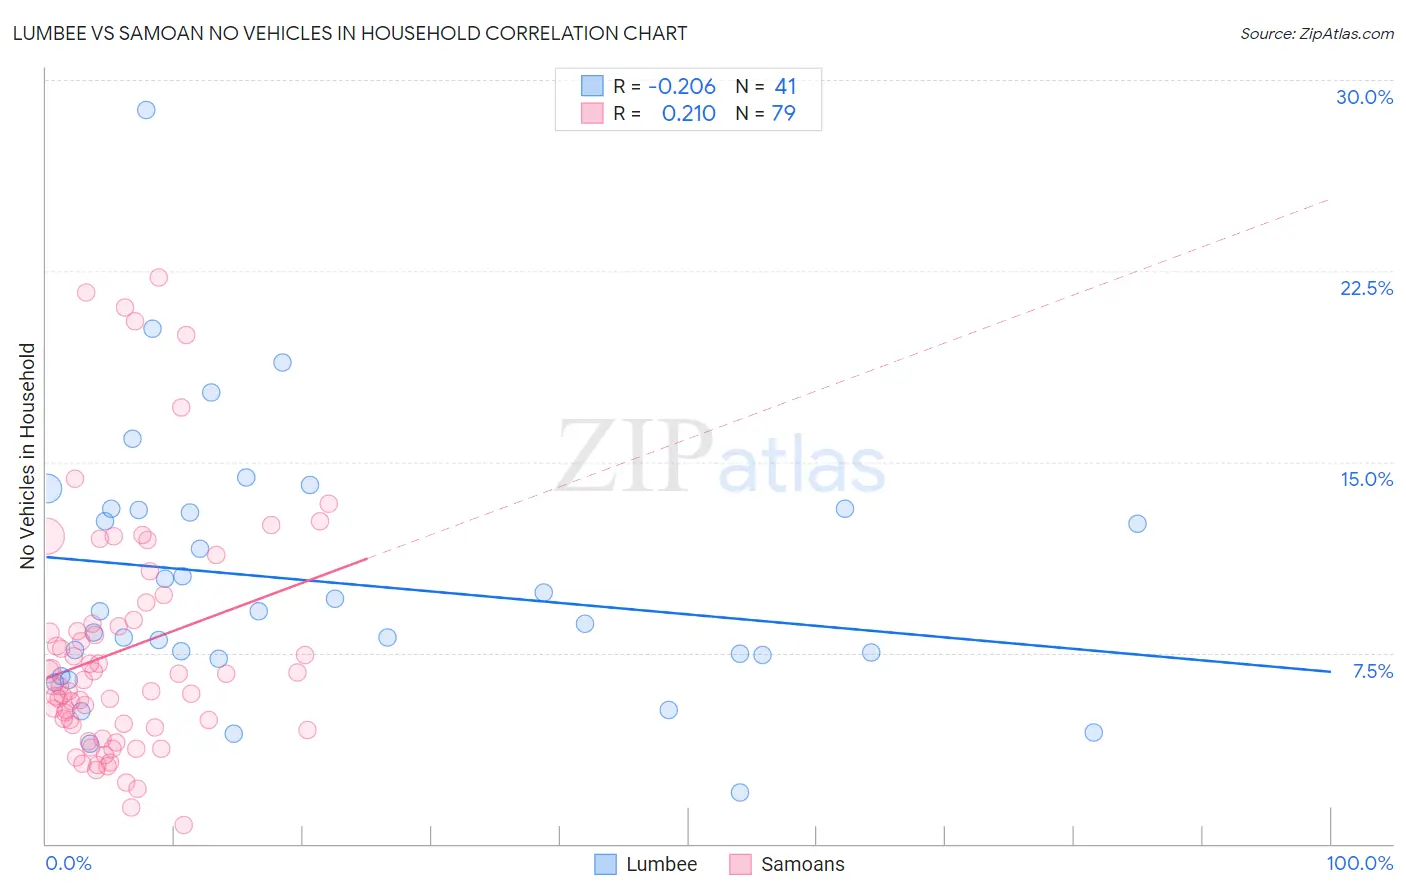
Lumbee vs Samoan No Vehicles in Household Correlation Chart
The statistical analysis conducted on geographies consisting of 92,166,207 people shows a weak negative correlation between the proportion of Lumbee and percentage of households with no vehicle available in the United States with a correlation coefficient (R) of -0.206 and weighted average of 10.3%. Similarly, the statistical analysis conducted on geographies consisting of 224,864,894 people shows a weak positive correlation between the proportion of Samoans and percentage of households with no vehicle available in the United States with a correlation coefficient (R) of 0.210 and weighted average of 7.6%, a difference of 35.4%.
No Vehicles in Household Correlation Summary
| Measurement | Lumbee | Samoan |
| Minimum | 2.0% | 0.73% |
| Maximum | 28.8% | 22.3% |
| Range | 26.8% | 21.5% |
| Mean | 10.3% | 7.6% |
| Median | 9.1% | 6.2% |
| Interquartile 25% (IQ1) | 7.3% | 4.6% |
| Interquartile 75% (IQ3) | 13.1% | 8.8% |
| Interquartile Range (IQR) | 5.8% | 4.2% |
| Standard Deviation (Sample) | 5.1% | 4.8% |
| Standard Deviation (Population) | 5.0% | 4.7% |
Similar Demographics by No Vehicles in Household
Demographics Similar to Lumbee by No Vehicles in Household
In terms of no vehicles in household, the demographic groups most similar to Lumbee are Immigrants from Latin America (10.4%, a difference of 0.21%), Indonesian (10.3%, a difference of 0.27%), Hmong (10.4%, a difference of 0.28%), Brazilian (10.4%, a difference of 0.42%), and Immigrants from Saudi Arabia (10.3%, a difference of 0.56%).
| Demographics | Rating | Rank | No Vehicles in Household |
| Immigrants | Austria | 64.4 /100 | #162 | Good 10.2% |
| Immigrants | Cambodia | 63.7 /100 | #163 | Good 10.2% |
| South Africans | 61.1 /100 | #164 | Good 10.2% |
| Comanche | 60.8 /100 | #165 | Good 10.2% |
| Immigrants | Costa Rica | 60.5 /100 | #166 | Good 10.3% |
| Immigrants | Saudi Arabia | 58.8 /100 | #167 | Average 10.3% |
| Indonesians | 56.7 /100 | #168 | Average 10.3% |
| Lumbee | 54.7 /100 | #169 | Average 10.3% |
| Immigrants | Latin America | 53.2 /100 | #170 | Average 10.4% |
| Hmong | 52.7 /100 | #171 | Average 10.4% |
| Brazilians | 51.7 /100 | #172 | Average 10.4% |
| Filipinos | 50.1 /100 | #173 | Average 10.4% |
| Immigrants | Sudan | 50.0 /100 | #174 | Average 10.4% |
| Immigrants | Burma/Myanmar | 49.1 /100 | #175 | Average 10.4% |
| French American Indians | 49.1 /100 | #176 | Average 10.4% |
Demographics Similar to Samoans by No Vehicles in Household
In terms of no vehicles in household, the demographic groups most similar to Samoans are American (7.7%, a difference of 0.29%), British (7.6%, a difference of 0.55%), Finnish (7.7%, a difference of 0.59%), Sri Lankan (7.6%, a difference of 0.60%), and Native Hawaiian (7.7%, a difference of 0.74%).
| Demographics | Rating | Rank | No Vehicles in Household |
| Nepalese | 100.0 /100 | #21 | Exceptional 7.4% |
| Irish | 100.0 /100 | #22 | Exceptional 7.4% |
| French | 100.0 /100 | #23 | Exceptional 7.4% |
| Immigrants | Iraq | 100.0 /100 | #24 | Exceptional 7.5% |
| Yaqui | 100.0 /100 | #25 | Exceptional 7.5% |
| Sri Lankans | 100.0 /100 | #26 | Exceptional 7.6% |
| British | 100.0 /100 | #27 | Exceptional 7.6% |
| Samoans | 100.0 /100 | #28 | Exceptional 7.6% |
| Americans | 100.0 /100 | #29 | Exceptional 7.7% |
| Finns | 100.0 /100 | #30 | Exceptional 7.7% |
| Native Hawaiians | 100.0 /100 | #31 | Exceptional 7.7% |
| Malaysians | 100.0 /100 | #32 | Exceptional 7.7% |
| Immigrants | Taiwan | 100.0 /100 | #33 | Exceptional 7.7% |
| Immigrants | Vietnam | 100.0 /100 | #34 | Exceptional 7.7% |
| Cherokee | 99.9 /100 | #35 | Exceptional 7.7% |