Aleut vs Nigerian No Vehicles in Household
COMPARE
Aleut
Nigerian
No Vehicles in Household
No Vehicles in Household Comparison
Aleuts
Nigerians
13.0%
NO VEHICLES IN HOUSEHOLD
0.1/ 100
METRIC RATING
277th/ 347
METRIC RANK
12.1%
NO VEHICLES IN HOUSEHOLD
0.9/ 100
METRIC RATING
257th/ 347
METRIC RANK
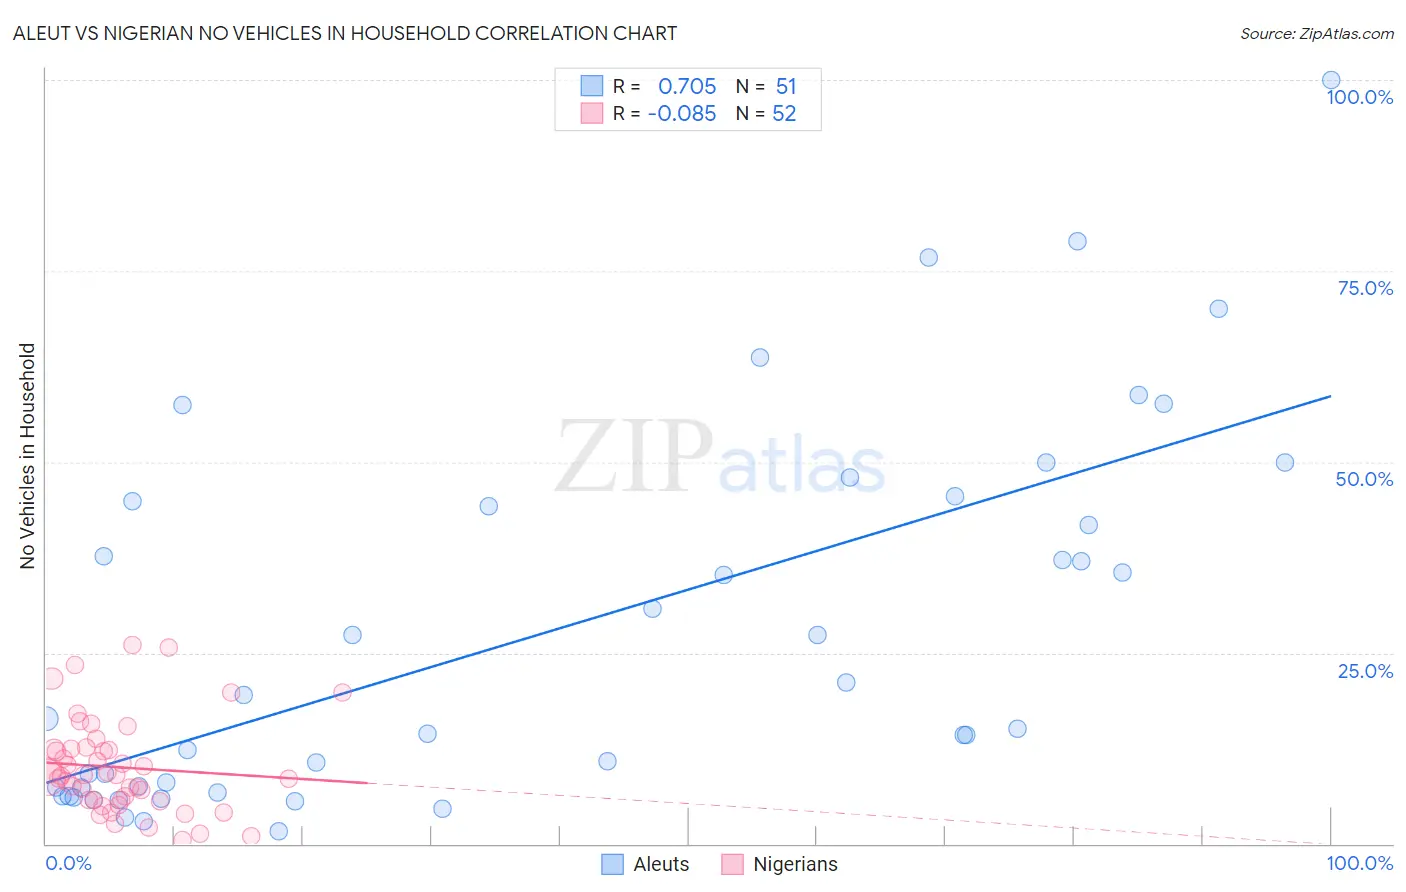
Aleut vs Nigerian No Vehicles in Household Correlation Chart
The statistical analysis conducted on geographies consisting of 61,729,503 people shows a strong positive correlation between the proportion of Aleuts and percentage of households with no vehicle available in the United States with a correlation coefficient (R) of 0.705 and weighted average of 13.0%. Similarly, the statistical analysis conducted on geographies consisting of 332,141,905 people shows a slight negative correlation between the proportion of Nigerians and percentage of households with no vehicle available in the United States with a correlation coefficient (R) of -0.085 and weighted average of 12.1%, a difference of 8.0%.
No Vehicles in Household Correlation Summary
| Measurement | Aleut | Nigerian |
| Minimum | 1.7% | 0.47% |
| Maximum | 100.0% | 26.0% |
| Range | 98.3% | 25.5% |
| Mean | 27.7% | 10.0% |
| Median | 16.4% | 8.9% |
| Interquartile 25% (IQ1) | 7.3% | 5.7% |
| Interquartile 75% (IQ3) | 44.8% | 12.4% |
| Interquartile Range (IQR) | 37.5% | 6.7% |
| Standard Deviation (Sample) | 24.2% | 6.1% |
| Standard Deviation (Population) | 23.9% | 6.0% |
Demographics Similar to Aleuts and Nigerians by No Vehicles in Household
In terms of no vehicles in household, the demographic groups most similar to Aleuts are Immigrants from Southern Europe (13.0%, a difference of 0.080%), Immigrants from Albania (13.0%, a difference of 0.44%), Immigrants from Singapore (12.9%, a difference of 0.62%), Immigrants from France (12.9%, a difference of 0.66%), and Bermudan (12.8%, a difference of 1.9%). Similarly, the demographic groups most similar to Nigerians are South American Indian (12.1%, a difference of 0.020%), Immigrants from Latvia (12.1%, a difference of 0.26%), Macedonian (12.2%, a difference of 0.82%), Subsaharan African (12.2%, a difference of 1.2%), and Immigrants from Liberia (12.2%, a difference of 1.3%).
| Demographics | Rating | Rank | No Vehicles in Household |
| Nigerians | 0.9 /100 | #257 | Tragic 12.1% |
| South American Indians | 0.9 /100 | #258 | Tragic 12.1% |
| Immigrants | Latvia | 0.8 /100 | #259 | Tragic 12.1% |
| Macedonians | 0.7 /100 | #260 | Tragic 12.2% |
| Sub-Saharan Africans | 0.6 /100 | #261 | Tragic 12.2% |
| Immigrants | Liberia | 0.6 /100 | #262 | Tragic 12.2% |
| Immigrants | Egypt | 0.6 /100 | #263 | Tragic 12.2% |
| Immigrants | Switzerland | 0.5 /100 | #264 | Tragic 12.3% |
| Africans | 0.4 /100 | #265 | Tragic 12.3% |
| Israelis | 0.3 /100 | #266 | Tragic 12.4% |
| Immigrants | Europe | 0.3 /100 | #267 | Tragic 12.5% |
| Immigrants | Africa | 0.2 /100 | #268 | Tragic 12.5% |
| Panamanians | 0.2 /100 | #269 | Tragic 12.5% |
| Immigrants | Northern Africa | 0.2 /100 | #270 | Tragic 12.6% |
| Immigrants | Morocco | 0.2 /100 | #271 | Tragic 12.6% |
| Bermudans | 0.1 /100 | #272 | Tragic 12.8% |
| Immigrants | France | 0.1 /100 | #273 | Tragic 12.9% |
| Immigrants | Singapore | 0.1 /100 | #274 | Tragic 12.9% |
| Immigrants | Albania | 0.1 /100 | #275 | Tragic 13.0% |
| Immigrants | Southern Europe | 0.1 /100 | #276 | Tragic 13.0% |
| Aleuts | 0.1 /100 | #277 | Tragic 13.0% |