Immigrants from Northern Africa vs Dutch No Vehicles in Household
COMPARE
Immigrants from Northern Africa
Dutch
No Vehicles in Household
No Vehicles in Household Comparison
Immigrants from Northern Africa
Dutch
12.6%
NO VEHICLES IN HOUSEHOLD
0.2/ 100
METRIC RATING
270th/ 347
METRIC RANK
6.8%
NO VEHICLES IN HOUSEHOLD
100.0/ 100
METRIC RATING
10th/ 347
METRIC RANK
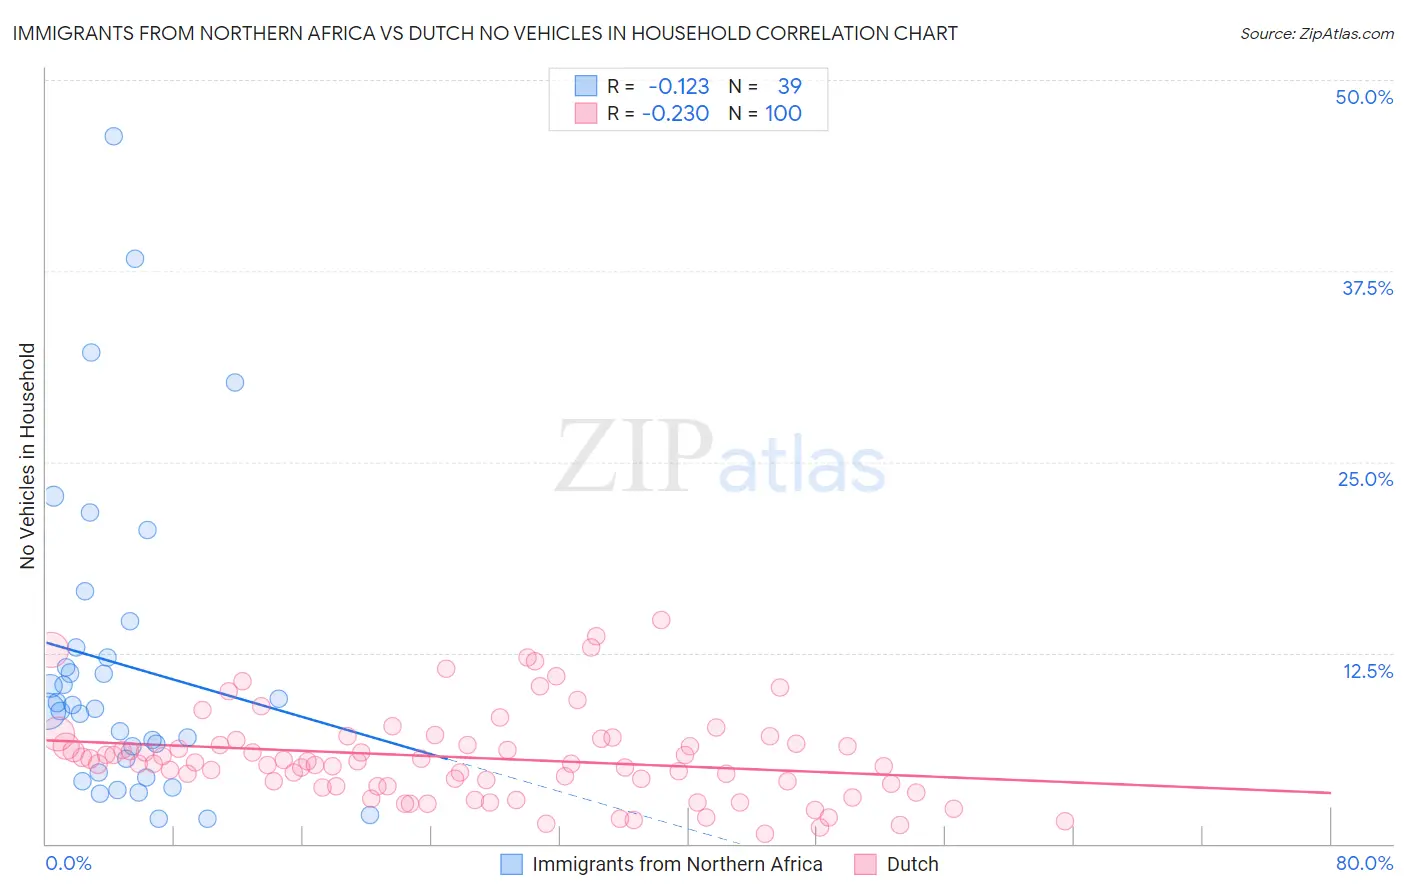
Immigrants from Northern Africa vs Dutch No Vehicles in Household Correlation Chart
The statistical analysis conducted on geographies consisting of 320,680,436 people shows a poor negative correlation between the proportion of Immigrants from Northern Africa and percentage of households with no vehicle available in the United States with a correlation coefficient (R) of -0.123 and weighted average of 12.6%. Similarly, the statistical analysis conducted on geographies consisting of 549,648,147 people shows a weak negative correlation between the proportion of Dutch and percentage of households with no vehicle available in the United States with a correlation coefficient (R) of -0.230 and weighted average of 6.8%, a difference of 84.2%.
No Vehicles in Household Correlation Summary
| Measurement | Immigrants from Northern Africa | Dutch |
| Minimum | 1.6% | 0.69% |
| Maximum | 46.3% | 14.7% |
| Range | 44.7% | 14.0% |
| Mean | 11.7% | 5.7% |
| Median | 8.8% | 5.3% |
| Interquartile 25% (IQ1) | 4.7% | 3.8% |
| Interquartile 75% (IQ3) | 12.8% | 6.6% |
| Interquartile Range (IQR) | 8.2% | 2.9% |
| Standard Deviation (Sample) | 10.2% | 2.9% |
| Standard Deviation (Population) | 10.1% | 2.9% |
Similar Demographics by No Vehicles in Household
Demographics Similar to Immigrants from Northern Africa by No Vehicles in Household
In terms of no vehicles in household, the demographic groups most similar to Immigrants from Northern Africa are Immigrants from Morocco (12.6%, a difference of 0.12%), Panamanian (12.5%, a difference of 0.55%), Immigrants from Africa (12.5%, a difference of 0.68%), Immigrants from Europe (12.5%, a difference of 0.73%), and Israeli (12.4%, a difference of 1.3%).
| Demographics | Rating | Rank | No Vehicles in Household |
| Immigrants | Egypt | 0.6 /100 | #263 | Tragic 12.2% |
| Immigrants | Switzerland | 0.5 /100 | #264 | Tragic 12.3% |
| Africans | 0.4 /100 | #265 | Tragic 12.3% |
| Israelis | 0.3 /100 | #266 | Tragic 12.4% |
| Immigrants | Europe | 0.3 /100 | #267 | Tragic 12.5% |
| Immigrants | Africa | 0.2 /100 | #268 | Tragic 12.5% |
| Panamanians | 0.2 /100 | #269 | Tragic 12.5% |
| Immigrants | Northern Africa | 0.2 /100 | #270 | Tragic 12.6% |
| Immigrants | Morocco | 0.2 /100 | #271 | Tragic 12.6% |
| Bermudans | 0.1 /100 | #272 | Tragic 12.8% |
| Immigrants | France | 0.1 /100 | #273 | Tragic 12.9% |
| Immigrants | Singapore | 0.1 /100 | #274 | Tragic 12.9% |
| Immigrants | Albania | 0.1 /100 | #275 | Tragic 13.0% |
| Immigrants | Southern Europe | 0.1 /100 | #276 | Tragic 13.0% |
| Aleuts | 0.1 /100 | #277 | Tragic 13.0% |
Demographics Similar to Dutch by No Vehicles in Household
In terms of no vehicles in household, the demographic groups most similar to Dutch are Scotch-Irish (6.8%, a difference of 0.51%), Czech (6.9%, a difference of 0.55%), Swedish (6.8%, a difference of 0.72%), Scottish (6.8%, a difference of 1.2%), and Assyrian/Chaldean/Syriac (7.0%, a difference of 2.0%).
| Demographics | Rating | Rank | No Vehicles in Household |
| English | 100.0 /100 | #3 | Exceptional 6.5% |
| Danes | 100.0 /100 | #4 | Exceptional 6.6% |
| Yakama | 100.0 /100 | #5 | Exceptional 6.6% |
| Germans | 100.0 /100 | #6 | Exceptional 6.7% |
| Scottish | 100.0 /100 | #7 | Exceptional 6.8% |
| Swedes | 100.0 /100 | #8 | Exceptional 6.8% |
| Scotch-Irish | 100.0 /100 | #9 | Exceptional 6.8% |
| Dutch | 100.0 /100 | #10 | Exceptional 6.8% |
| Czechs | 100.0 /100 | #11 | Exceptional 6.9% |
| Assyrians/Chaldeans/Syriacs | 100.0 /100 | #12 | Exceptional 7.0% |
| Scandinavians | 100.0 /100 | #13 | Exceptional 7.0% |
| Mexicans | 100.0 /100 | #14 | Exceptional 7.0% |
| Whites/Caucasians | 100.0 /100 | #15 | Exceptional 7.0% |
| Europeans | 100.0 /100 | #16 | Exceptional 7.1% |
| Welsh | 100.0 /100 | #17 | Exceptional 7.2% |