Immigrants from Venezuela vs Subsaharan African No Vehicles in Household
COMPARE
Immigrants from Venezuela
Subsaharan African
No Vehicles in Household
No Vehicles in Household Comparison
Immigrants from Venezuela
Sub-Saharan Africans
8.1%
NO VEHICLES IN HOUSEHOLD
99.9/ 100
METRIC RATING
54th/ 347
METRIC RANK
12.2%
NO VEHICLES IN HOUSEHOLD
0.6/ 100
METRIC RATING
261st/ 347
METRIC RANK
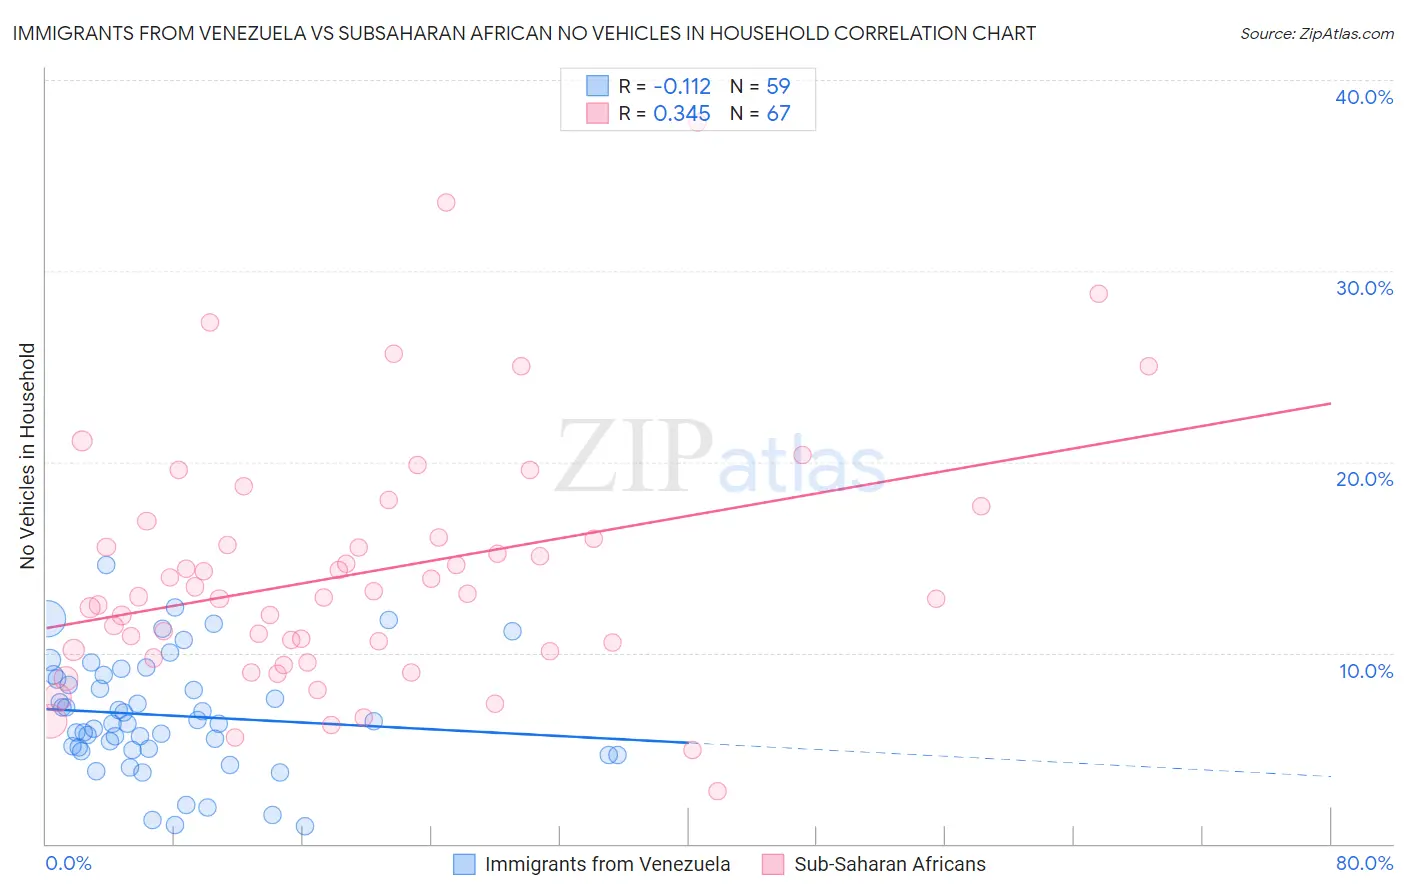
Immigrants from Venezuela vs Subsaharan African No Vehicles in Household Correlation Chart
The statistical analysis conducted on geographies consisting of 287,495,682 people shows a poor negative correlation between the proportion of Immigrants from Venezuela and percentage of households with no vehicle available in the United States with a correlation coefficient (R) of -0.112 and weighted average of 8.1%. Similarly, the statistical analysis conducted on geographies consisting of 506,014,655 people shows a mild positive correlation between the proportion of Sub-Saharan Africans and percentage of households with no vehicle available in the United States with a correlation coefficient (R) of 0.345 and weighted average of 12.2%, a difference of 51.3%.
No Vehicles in Household Correlation Summary
| Measurement | Immigrants from Venezuela | Subsaharan African |
| Minimum | 0.90% | 2.7% |
| Maximum | 14.6% | 37.8% |
| Range | 13.7% | 35.0% |
| Mean | 6.7% | 14.2% |
| Median | 6.3% | 12.9% |
| Interquartile 25% (IQ1) | 4.9% | 10.1% |
| Interquartile 75% (IQ3) | 8.8% | 16.0% |
| Interquartile Range (IQR) | 3.9% | 5.9% |
| Standard Deviation (Sample) | 3.0% | 6.6% |
| Standard Deviation (Population) | 3.0% | 6.5% |
Similar Demographics by No Vehicles in Household
Demographics Similar to Immigrants from Venezuela by No Vehicles in Household
In terms of no vehicles in household, the demographic groups most similar to Immigrants from Venezuela are Celtic (8.1%, a difference of 0.090%), Hawaiian (8.0%, a difference of 0.31%), Slovene (8.0%, a difference of 0.31%), Immigrants from Afghanistan (8.1%, a difference of 0.48%), and Venezuelan (8.1%, a difference of 0.77%).
| Demographics | Rating | Rank | No Vehicles in Household |
| Northern Europeans | 99.9 /100 | #47 | Exceptional 7.9% |
| Afghans | 99.9 /100 | #48 | Exceptional 8.0% |
| Guamanians/Chamorros | 99.9 /100 | #49 | Exceptional 8.0% |
| Belgians | 99.9 /100 | #50 | Exceptional 8.0% |
| Koreans | 99.9 /100 | #51 | Exceptional 8.0% |
| Hawaiians | 99.9 /100 | #52 | Exceptional 8.0% |
| Slovenes | 99.9 /100 | #53 | Exceptional 8.0% |
| Immigrants | Venezuela | 99.9 /100 | #54 | Exceptional 8.1% |
| Celtics | 99.9 /100 | #55 | Exceptional 8.1% |
| Immigrants | Afghanistan | 99.9 /100 | #56 | Exceptional 8.1% |
| Venezuelans | 99.8 /100 | #57 | Exceptional 8.1% |
| Immigrants | Mexico | 99.8 /100 | #58 | Exceptional 8.1% |
| Immigrants | India | 99.8 /100 | #59 | Exceptional 8.2% |
| Immigrants | Laos | 99.8 /100 | #60 | Exceptional 8.2% |
| Thais | 99.8 /100 | #61 | Exceptional 8.2% |
Demographics Similar to Sub-Saharan Africans by No Vehicles in Household
In terms of no vehicles in household, the demographic groups most similar to Sub-Saharan Africans are Immigrants from Liberia (12.2%, a difference of 0.070%), Immigrants from Egypt (12.2%, a difference of 0.22%), Macedonian (12.2%, a difference of 0.39%), Immigrants from Switzerland (12.3%, a difference of 0.69%), and African (12.3%, a difference of 0.93%).
| Demographics | Rating | Rank | No Vehicles in Household |
| Immigrants | Uruguay | 1.3 /100 | #254 | Tragic 11.9% |
| Hondurans | 1.2 /100 | #255 | Tragic 12.0% |
| Liberians | 1.2 /100 | #256 | Tragic 12.0% |
| Nigerians | 0.9 /100 | #257 | Tragic 12.1% |
| South American Indians | 0.9 /100 | #258 | Tragic 12.1% |
| Immigrants | Latvia | 0.8 /100 | #259 | Tragic 12.1% |
| Macedonians | 0.7 /100 | #260 | Tragic 12.2% |
| Sub-Saharan Africans | 0.6 /100 | #261 | Tragic 12.2% |
| Immigrants | Liberia | 0.6 /100 | #262 | Tragic 12.2% |
| Immigrants | Egypt | 0.6 /100 | #263 | Tragic 12.2% |
| Immigrants | Switzerland | 0.5 /100 | #264 | Tragic 12.3% |
| Africans | 0.4 /100 | #265 | Tragic 12.3% |
| Israelis | 0.3 /100 | #266 | Tragic 12.4% |
| Immigrants | Europe | 0.3 /100 | #267 | Tragic 12.5% |
| Immigrants | Africa | 0.2 /100 | #268 | Tragic 12.5% |