Immigrants from Venezuela vs Immigrants from Iran No Vehicles in Household
COMPARE
Immigrants from Venezuela
Immigrants from Iran
No Vehicles in Household
No Vehicles in Household Comparison
Immigrants from Venezuela
Immigrants from Iran
8.1%
NO VEHICLES IN HOUSEHOLD
99.9/ 100
METRIC RATING
54th/ 347
METRIC RANK
8.4%
NO VEHICLES IN HOUSEHOLD
99.7/ 100
METRIC RATING
68th/ 347
METRIC RANK
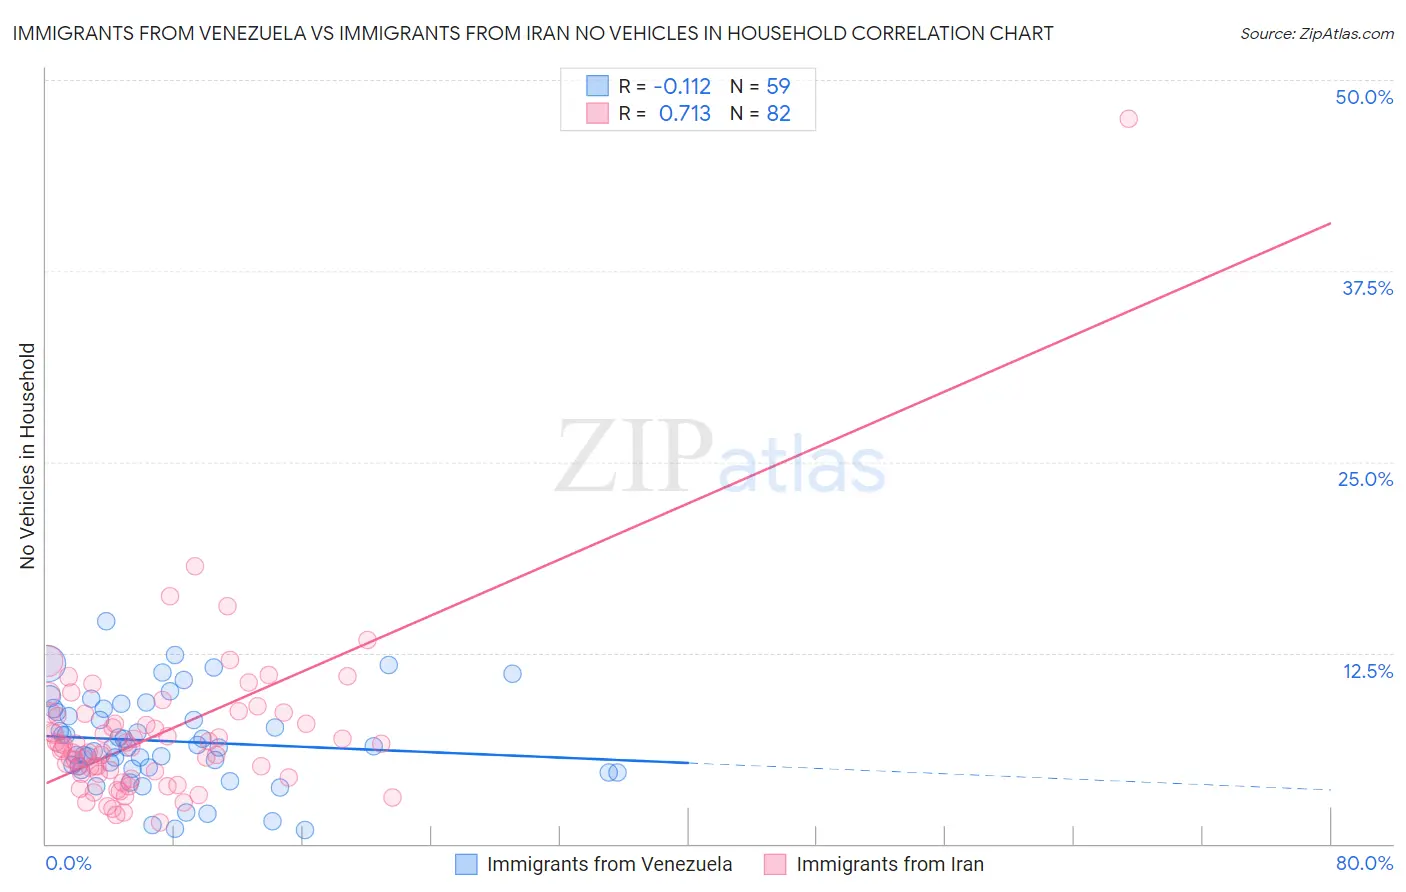
Immigrants from Venezuela vs Immigrants from Iran No Vehicles in Household Correlation Chart
The statistical analysis conducted on geographies consisting of 287,495,682 people shows a poor negative correlation between the proportion of Immigrants from Venezuela and percentage of households with no vehicle available in the United States with a correlation coefficient (R) of -0.112 and weighted average of 8.1%. Similarly, the statistical analysis conducted on geographies consisting of 279,496,413 people shows a strong positive correlation between the proportion of Immigrants from Iran and percentage of households with no vehicle available in the United States with a correlation coefficient (R) of 0.713 and weighted average of 8.4%, a difference of 3.7%.
No Vehicles in Household Correlation Summary
| Measurement | Immigrants from Venezuela | Immigrants from Iran |
| Minimum | 0.90% | 1.4% |
| Maximum | 14.6% | 47.4% |
| Range | 13.7% | 46.0% |
| Mean | 6.7% | 7.1% |
| Median | 6.3% | 6.3% |
| Interquartile 25% (IQ1) | 4.9% | 4.6% |
| Interquartile 75% (IQ3) | 8.8% | 8.4% |
| Interquartile Range (IQR) | 3.9% | 3.8% |
| Standard Deviation (Sample) | 3.0% | 5.5% |
| Standard Deviation (Population) | 3.0% | 5.5% |
Demographics Similar to Immigrants from Venezuela and Immigrants from Iran by No Vehicles in Household
In terms of no vehicles in household, the demographic groups most similar to Immigrants from Venezuela are Celtic (8.1%, a difference of 0.090%), Hawaiian (8.0%, a difference of 0.31%), Slovene (8.0%, a difference of 0.31%), Immigrants from Afghanistan (8.1%, a difference of 0.48%), and Venezuelan (8.1%, a difference of 0.77%). Similarly, the demographic groups most similar to Immigrants from Iran are Spaniard (8.4%, a difference of 0.050%), Immigrants from Scotland (8.3%, a difference of 0.40%), Palestinian (8.3%, a difference of 0.41%), Canadian (8.3%, a difference of 0.52%), and Cajun (8.4%, a difference of 0.78%).
| Demographics | Rating | Rank | No Vehicles in Household |
| Koreans | 99.9 /100 | #51 | Exceptional 8.0% |
| Hawaiians | 99.9 /100 | #52 | Exceptional 8.0% |
| Slovenes | 99.9 /100 | #53 | Exceptional 8.0% |
| Immigrants | Venezuela | 99.9 /100 | #54 | Exceptional 8.1% |
| Celtics | 99.9 /100 | #55 | Exceptional 8.1% |
| Immigrants | Afghanistan | 99.9 /100 | #56 | Exceptional 8.1% |
| Venezuelans | 99.8 /100 | #57 | Exceptional 8.1% |
| Immigrants | Mexico | 99.8 /100 | #58 | Exceptional 8.1% |
| Immigrants | India | 99.8 /100 | #59 | Exceptional 8.2% |
| Immigrants | Laos | 99.8 /100 | #60 | Exceptional 8.2% |
| Thais | 99.8 /100 | #61 | Exceptional 8.2% |
| Chinese | 99.8 /100 | #62 | Exceptional 8.2% |
| Slovaks | 99.8 /100 | #63 | Exceptional 8.3% |
| Croatians | 99.8 /100 | #64 | Exceptional 8.3% |
| Canadians | 99.7 /100 | #65 | Exceptional 8.3% |
| Palestinians | 99.7 /100 | #66 | Exceptional 8.3% |
| Immigrants | Scotland | 99.7 /100 | #67 | Exceptional 8.3% |
| Immigrants | Iran | 99.7 /100 | #68 | Exceptional 8.4% |
| Spaniards | 99.7 /100 | #69 | Exceptional 8.4% |
| Cajuns | 99.6 /100 | #70 | Exceptional 8.4% |
| Immigrants | Lebanon | 99.6 /100 | #71 | Exceptional 8.4% |