Immigrants from Taiwan vs Tongan No Vehicles in Household
COMPARE
Immigrants from Taiwan
Tongan
No Vehicles in Household
No Vehicles in Household Comparison
Immigrants from Taiwan
Tongans
7.7%
NO VEHICLES IN HOUSEHOLD
100.0/ 100
METRIC RATING
33rd/ 347
METRIC RANK
7.2%
NO VEHICLES IN HOUSEHOLD
100.0/ 100
METRIC RATING
18th/ 347
METRIC RANK
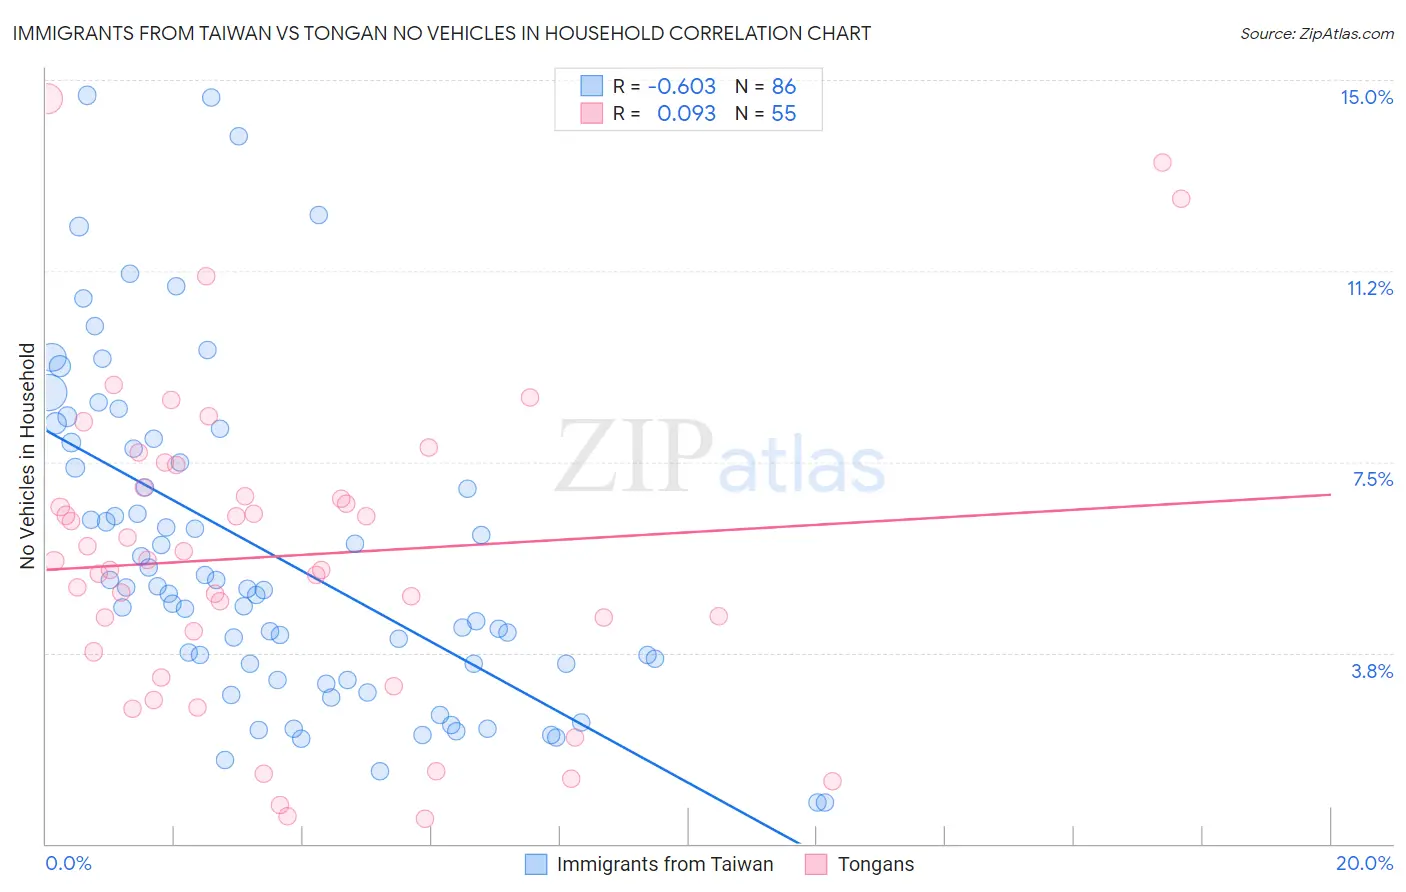
Immigrants from Taiwan vs Tongan No Vehicles in Household Correlation Chart
The statistical analysis conducted on geographies consisting of 276,659,382 people shows a significant negative correlation between the proportion of Immigrants from Taiwan and percentage of households with no vehicle available in the United States with a correlation coefficient (R) of -0.603 and weighted average of 7.7%. Similarly, the statistical analysis conducted on geographies consisting of 102,807,685 people shows a slight positive correlation between the proportion of Tongans and percentage of households with no vehicle available in the United States with a correlation coefficient (R) of 0.093 and weighted average of 7.2%, a difference of 7.6%.
No Vehicles in Household Correlation Summary
| Measurement | Immigrants from Taiwan | Tongan |
| Minimum | 0.80% | 0.49% |
| Maximum | 14.7% | 14.6% |
| Range | 13.9% | 14.1% |
| Mean | 5.7% | 5.7% |
| Median | 5.0% | 5.5% |
| Interquartile 25% (IQ1) | 3.5% | 3.8% |
| Interquartile 75% (IQ3) | 7.8% | 7.0% |
| Interquartile Range (IQR) | 4.2% | 3.2% |
| Standard Deviation (Sample) | 3.2% | 3.1% |
| Standard Deviation (Population) | 3.2% | 3.0% |
Demographics Similar to Immigrants from Taiwan and Tongans by No Vehicles in Household
In terms of no vehicles in household, the demographic groups most similar to Immigrants from Taiwan are Malaysian (7.7%, a difference of 0.11%), Immigrants from Vietnam (7.7%, a difference of 0.13%), Cherokee (7.7%, a difference of 0.27%), Native Hawaiian (7.7%, a difference of 0.36%), and Finnish (7.7%, a difference of 0.51%). Similarly, the demographic groups most similar to Tongans are Welsh (7.2%, a difference of 0.21%), European (7.1%, a difference of 0.78%), White/Caucasian (7.0%, a difference of 1.9%), Arapaho (7.4%, a difference of 2.5%), and Ottawa (7.4%, a difference of 2.9%).
| Demographics | Rating | Rank | No Vehicles in Household |
| Whites/Caucasians | 100.0 /100 | #15 | Exceptional 7.0% |
| Europeans | 100.0 /100 | #16 | Exceptional 7.1% |
| Welsh | 100.0 /100 | #17 | Exceptional 7.2% |
| Tongans | 100.0 /100 | #18 | Exceptional 7.2% |
| Arapaho | 100.0 /100 | #19 | Exceptional 7.4% |
| Ottawa | 100.0 /100 | #20 | Exceptional 7.4% |
| Nepalese | 100.0 /100 | #21 | Exceptional 7.4% |
| Irish | 100.0 /100 | #22 | Exceptional 7.4% |
| French | 100.0 /100 | #23 | Exceptional 7.4% |
| Immigrants | Iraq | 100.0 /100 | #24 | Exceptional 7.5% |
| Yaqui | 100.0 /100 | #25 | Exceptional 7.5% |
| Sri Lankans | 100.0 /100 | #26 | Exceptional 7.6% |
| British | 100.0 /100 | #27 | Exceptional 7.6% |
| Samoans | 100.0 /100 | #28 | Exceptional 7.6% |
| Americans | 100.0 /100 | #29 | Exceptional 7.7% |
| Finns | 100.0 /100 | #30 | Exceptional 7.7% |
| Native Hawaiians | 100.0 /100 | #31 | Exceptional 7.7% |
| Malaysians | 100.0 /100 | #32 | Exceptional 7.7% |
| Immigrants | Taiwan | 100.0 /100 | #33 | Exceptional 7.7% |
| Immigrants | Vietnam | 100.0 /100 | #34 | Exceptional 7.7% |
| Cherokee | 99.9 /100 | #35 | Exceptional 7.7% |