Dominican vs Malaysian 1 or more Vehicles in Household
COMPARE
Dominican
Malaysian
1 or more Vehicles in Household
1 or more Vehicles in Household Comparison
Dominicans
Malaysians
70.7%
1 OR MORE VEHICLES IN HOUSEHOLD
0.0/ 100
METRIC RATING
340th/ 347
METRIC RANK
92.3%
1 OR MORE VEHICLES IN HOUSEHOLD
99.9/ 100
METRIC RATING
36th/ 347
METRIC RANK
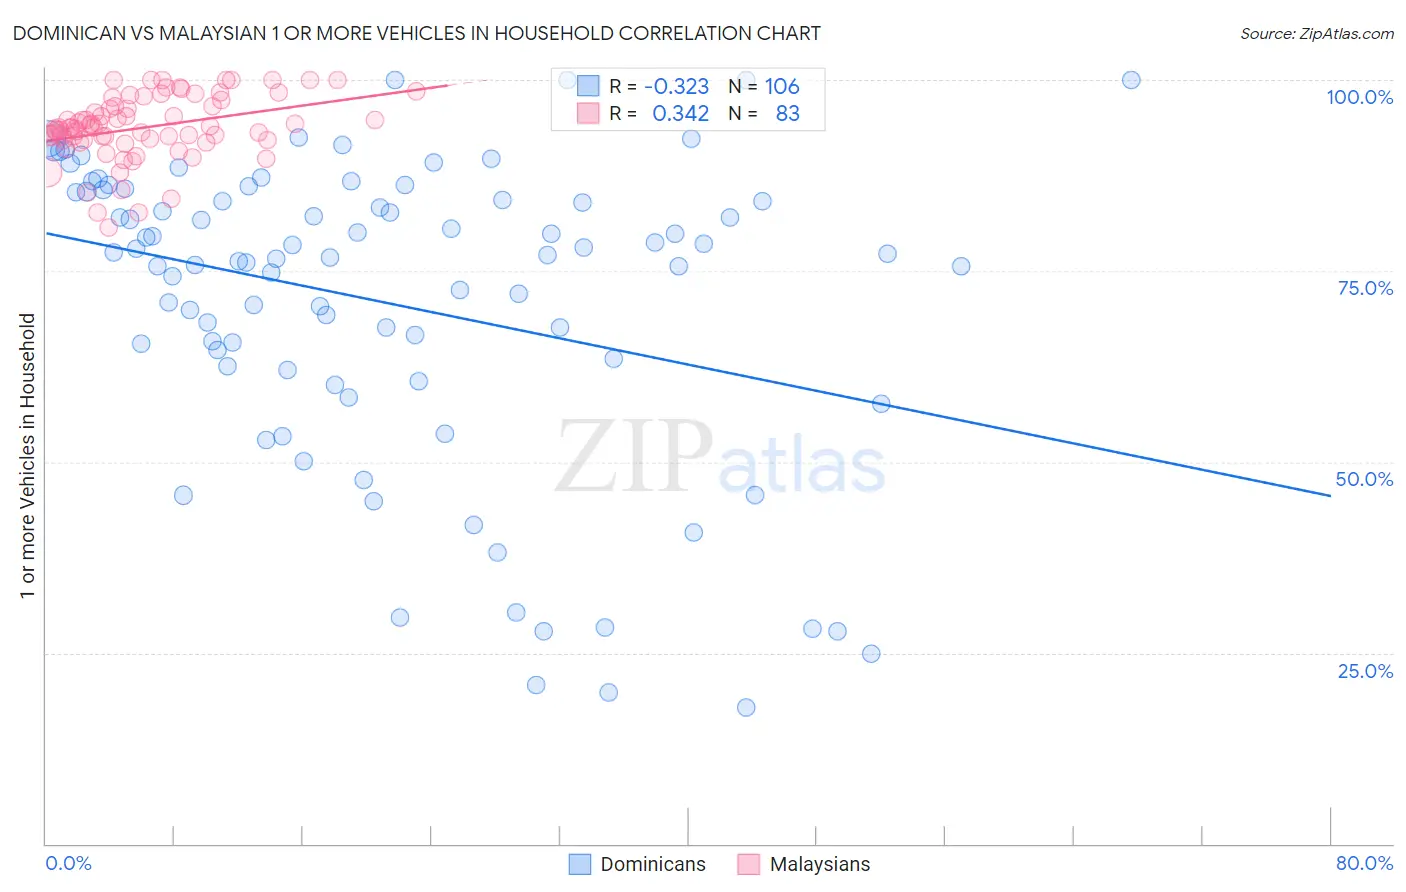
Dominican vs Malaysian 1 or more Vehicles in Household Correlation Chart
The statistical analysis conducted on geographies consisting of 354,814,158 people shows a mild negative correlation between the proportion of Dominicans and percentage of households with 1 or more vehicles available in the United States with a correlation coefficient (R) of -0.323 and weighted average of 70.7%. Similarly, the statistical analysis conducted on geographies consisting of 226,025,897 people shows a mild positive correlation between the proportion of Malaysians and percentage of households with 1 or more vehicles available in the United States with a correlation coefficient (R) of 0.342 and weighted average of 92.3%, a difference of 30.6%.
1 or more Vehicles in Household Correlation Summary
| Measurement | Dominican | Malaysian |
| Minimum | 17.9% | 80.7% |
| Maximum | 100.0% | 100.0% |
| Range | 82.1% | 19.3% |
| Mean | 70.9% | 93.8% |
| Median | 77.0% | 93.7% |
| Interquartile 25% (IQ1) | 62.5% | 92.2% |
| Interquartile 75% (IQ3) | 85.3% | 96.6% |
| Interquartile Range (IQR) | 22.8% | 4.4% |
| Standard Deviation (Sample) | 20.0% | 4.2% |
| Standard Deviation (Population) | 19.9% | 4.2% |
Similar Demographics by 1 or more Vehicles in Household
Demographics Similar to Dominicans by 1 or more Vehicles in Household
In terms of 1 or more vehicles in household, the demographic groups most similar to Dominicans are Immigrants from Barbados (70.6%, a difference of 0.13%), Immigrants from Guyana (70.6%, a difference of 0.15%), Guyanese (70.8%, a difference of 0.19%), British West Indian (70.4%, a difference of 0.46%), and Inupiat (71.5%, a difference of 1.2%).
| Demographics | Rating | Rank | 1 or more Vehicles in Household |
| Immigrants | Ecuador | 0.0 /100 | #333 | Tragic 76.2% |
| Immigrants | Bangladesh | 0.0 /100 | #334 | Tragic 74.3% |
| Barbadians | 0.0 /100 | #335 | Tragic 74.0% |
| Vietnamese | 0.0 /100 | #336 | Tragic 73.8% |
| Immigrants | Uzbekistan | 0.0 /100 | #337 | Tragic 73.4% |
| Inupiat | 0.0 /100 | #338 | Tragic 71.5% |
| Guyanese | 0.0 /100 | #339 | Tragic 70.8% |
| Dominicans | 0.0 /100 | #340 | Tragic 70.7% |
| Immigrants | Barbados | 0.0 /100 | #341 | Tragic 70.6% |
| Immigrants | Guyana | 0.0 /100 | #342 | Tragic 70.6% |
| British West Indians | 0.0 /100 | #343 | Tragic 70.4% |
| Immigrants | Dominican Republic | 0.0 /100 | #344 | Tragic 68.6% |
| Immigrants | St. Vincent and the Grenadines | 0.0 /100 | #345 | Tragic 64.7% |
| Immigrants | Grenada | 0.0 /100 | #346 | Tragic 62.7% |
| Yup'ik | 0.0 /100 | #347 | Tragic 58.4% |
Demographics Similar to Malaysians by 1 or more Vehicles in Household
In terms of 1 or more vehicles in household, the demographic groups most similar to Malaysians are Czechoslovakian (92.3%, a difference of 0.0%), Italian (92.3%, a difference of 0.010%), French Canadian (92.3%, a difference of 0.010%), Immigrants from Vietnam (92.3%, a difference of 0.010%), and Swiss (92.3%, a difference of 0.020%).
| Demographics | Rating | Rank | 1 or more Vehicles in Household |
| Native Hawaiians | 100.0 /100 | #29 | Exceptional 92.4% |
| Finns | 100.0 /100 | #30 | Exceptional 92.4% |
| Samoans | 100.0 /100 | #31 | Exceptional 92.4% |
| Basques | 100.0 /100 | #32 | Exceptional 92.4% |
| Cherokee | 100.0 /100 | #33 | Exceptional 92.4% |
| Italians | 99.9 /100 | #34 | Exceptional 92.3% |
| Czechoslovakians | 99.9 /100 | #35 | Exceptional 92.3% |
| Malaysians | 99.9 /100 | #36 | Exceptional 92.3% |
| French Canadians | 99.9 /100 | #37 | Exceptional 92.3% |
| Immigrants | Vietnam | 99.9 /100 | #38 | Exceptional 92.3% |
| Swiss | 99.9 /100 | #39 | Exceptional 92.3% |
| Creek | 99.9 /100 | #40 | Exceptional 92.3% |
| Immigrants | Taiwan | 99.9 /100 | #41 | Exceptional 92.3% |
| Chickasaw | 99.9 /100 | #42 | Exceptional 92.3% |
| Spanish | 99.9 /100 | #43 | Exceptional 92.3% |