Immigrants from Malaysia vs Malaysian 1 or more Vehicles in Household
COMPARE
Immigrants from Malaysia
Malaysian
1 or more Vehicles in Household
1 or more Vehicles in Household Comparison
Immigrants from Malaysia
Malaysians
86.5%
1 OR MORE VEHICLES IN HOUSEHOLD
0.0/ 100
METRIC RATING
287th/ 347
METRIC RANK
92.3%
1 OR MORE VEHICLES IN HOUSEHOLD
99.9/ 100
METRIC RATING
36th/ 347
METRIC RANK
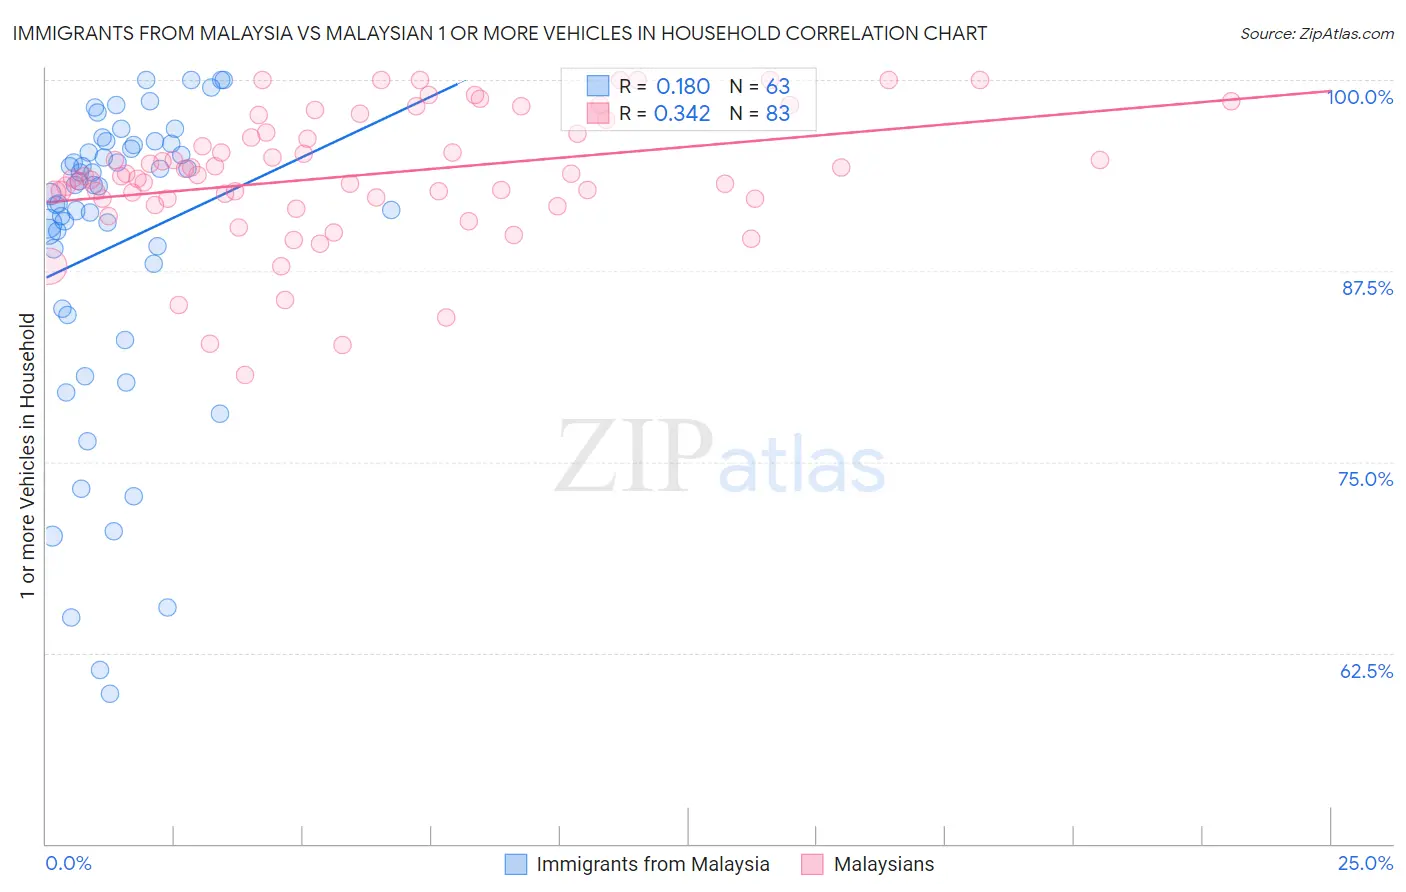
Immigrants from Malaysia vs Malaysian 1 or more Vehicles in Household Correlation Chart
The statistical analysis conducted on geographies consisting of 197,926,465 people shows a poor positive correlation between the proportion of Immigrants from Malaysia and percentage of households with 1 or more vehicles available in the United States with a correlation coefficient (R) of 0.180 and weighted average of 86.5%. Similarly, the statistical analysis conducted on geographies consisting of 226,025,897 people shows a mild positive correlation between the proportion of Malaysians and percentage of households with 1 or more vehicles available in the United States with a correlation coefficient (R) of 0.342 and weighted average of 92.3%, a difference of 6.8%.
1 or more Vehicles in Household Correlation Summary
| Measurement | Immigrants from Malaysia | Malaysian |
| Minimum | 59.8% | 80.7% |
| Maximum | 100.0% | 100.0% |
| Range | 40.2% | 19.3% |
| Mean | 89.2% | 93.8% |
| Median | 93.0% | 93.7% |
| Interquartile 25% (IQ1) | 85.0% | 92.2% |
| Interquartile 75% (IQ3) | 95.7% | 96.6% |
| Interquartile Range (IQR) | 10.7% | 4.4% |
| Standard Deviation (Sample) | 10.1% | 4.2% |
| Standard Deviation (Population) | 10.0% | 4.2% |
Similar Demographics by 1 or more Vehicles in Household
Demographics Similar to Immigrants from Malaysia by 1 or more Vehicles in Household
In terms of 1 or more vehicles in household, the demographic groups most similar to Immigrants from Malaysia are Hopi (86.4%, a difference of 0.070%), Immigrants from Eastern Asia (86.5%, a difference of 0.080%), Immigrants from Ireland (86.4%, a difference of 0.090%), Immigrants from Kazakhstan (86.6%, a difference of 0.11%), and Immigrants from Australia (86.4%, a difference of 0.13%).
| Demographics | Rating | Rank | 1 or more Vehicles in Household |
| Immigrants | Croatia | 0.0 /100 | #280 | Tragic 87.0% |
| Mongolians | 0.0 /100 | #281 | Tragic 87.0% |
| Colville | 0.0 /100 | #282 | Tragic 86.8% |
| Immigrants | Eastern Europe | 0.0 /100 | #283 | Tragic 86.7% |
| Central American Indians | 0.0 /100 | #284 | Tragic 86.7% |
| Immigrants | Kazakhstan | 0.0 /100 | #285 | Tragic 86.6% |
| Immigrants | Eastern Asia | 0.0 /100 | #286 | Tragic 86.5% |
| Immigrants | Malaysia | 0.0 /100 | #287 | Tragic 86.5% |
| Hopi | 0.0 /100 | #288 | Tragic 86.4% |
| Immigrants | Ireland | 0.0 /100 | #289 | Tragic 86.4% |
| Immigrants | Australia | 0.0 /100 | #290 | Tragic 86.4% |
| Pima | 0.0 /100 | #291 | Tragic 86.3% |
| Okinawans | 0.0 /100 | #292 | Tragic 86.1% |
| Indians (Asian) | 0.0 /100 | #293 | Tragic 86.0% |
| Alaskan Athabascans | 0.0 /100 | #294 | Tragic 86.0% |
Demographics Similar to Malaysians by 1 or more Vehicles in Household
In terms of 1 or more vehicles in household, the demographic groups most similar to Malaysians are Czechoslovakian (92.3%, a difference of 0.0%), Italian (92.3%, a difference of 0.010%), French Canadian (92.3%, a difference of 0.010%), Immigrants from Vietnam (92.3%, a difference of 0.010%), and Swiss (92.3%, a difference of 0.020%).
| Demographics | Rating | Rank | 1 or more Vehicles in Household |
| Native Hawaiians | 100.0 /100 | #29 | Exceptional 92.4% |
| Finns | 100.0 /100 | #30 | Exceptional 92.4% |
| Samoans | 100.0 /100 | #31 | Exceptional 92.4% |
| Basques | 100.0 /100 | #32 | Exceptional 92.4% |
| Cherokee | 100.0 /100 | #33 | Exceptional 92.4% |
| Italians | 99.9 /100 | #34 | Exceptional 92.3% |
| Czechoslovakians | 99.9 /100 | #35 | Exceptional 92.3% |
| Malaysians | 99.9 /100 | #36 | Exceptional 92.3% |
| French Canadians | 99.9 /100 | #37 | Exceptional 92.3% |
| Immigrants | Vietnam | 99.9 /100 | #38 | Exceptional 92.3% |
| Swiss | 99.9 /100 | #39 | Exceptional 92.3% |
| Creek | 99.9 /100 | #40 | Exceptional 92.3% |
| Immigrants | Taiwan | 99.9 /100 | #41 | Exceptional 92.3% |
| Chickasaw | 99.9 /100 | #42 | Exceptional 92.3% |
| Spanish | 99.9 /100 | #43 | Exceptional 92.3% |