Immigrants from Sudan vs Salvadoran No Vehicles in Household
COMPARE
Immigrants from Sudan
Salvadoran
No Vehicles in Household
No Vehicles in Household Comparison
Immigrants from Sudan
Salvadorans
10.4%
NO VEHICLES IN HOUSEHOLD
50.0/ 100
METRIC RATING
174th/ 347
METRIC RANK
10.1%
NO VEHICLES IN HOUSEHOLD
72.4/ 100
METRIC RATING
155th/ 347
METRIC RANK
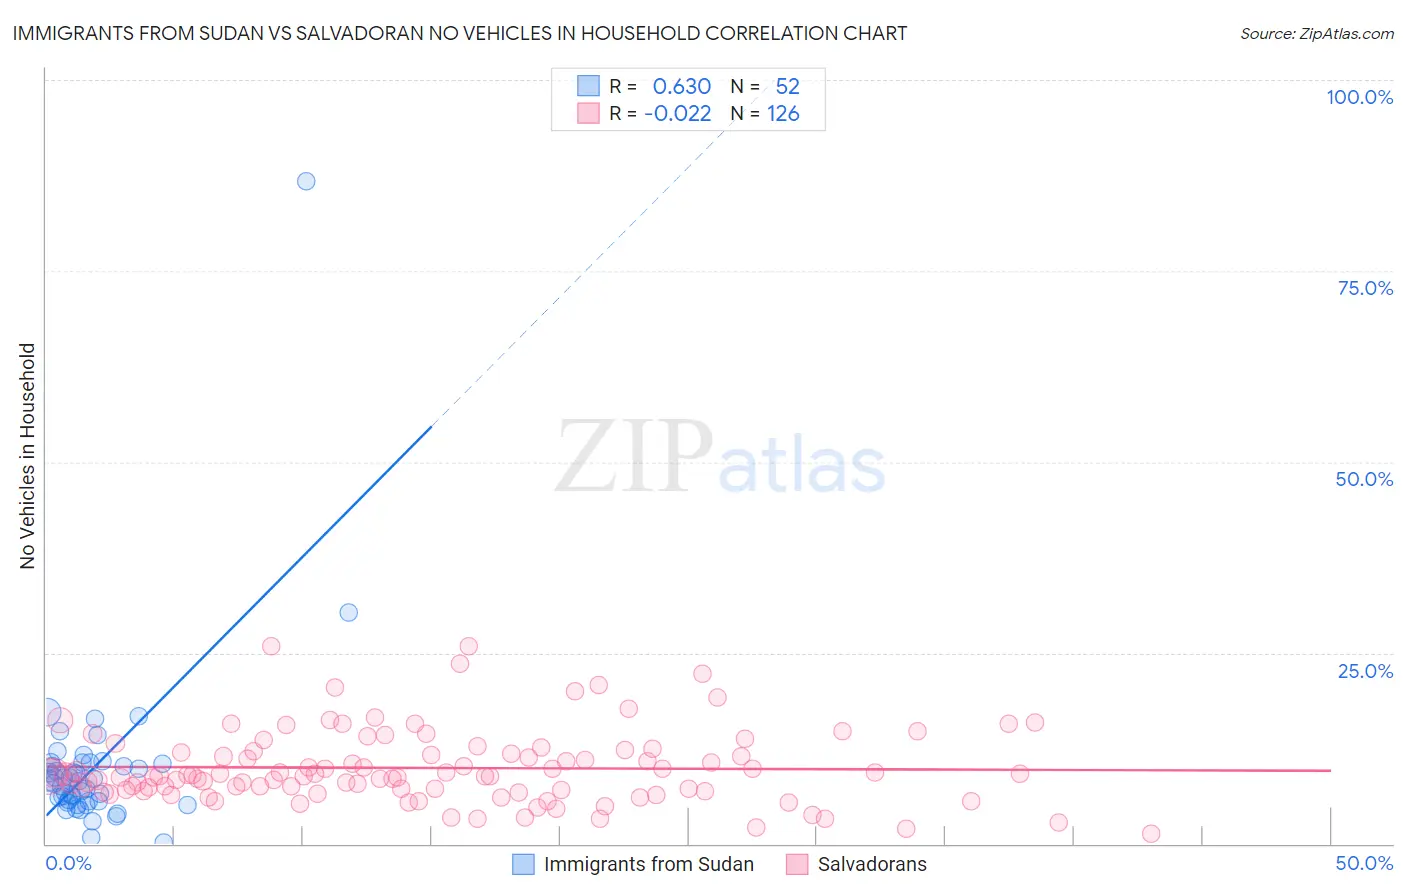
Immigrants from Sudan vs Salvadoran No Vehicles in Household Correlation Chart
The statistical analysis conducted on geographies consisting of 118,914,710 people shows a significant positive correlation between the proportion of Immigrants from Sudan and percentage of households with no vehicle available in the United States with a correlation coefficient (R) of 0.630 and weighted average of 10.4%. Similarly, the statistical analysis conducted on geographies consisting of 397,977,733 people shows no correlation between the proportion of Salvadorans and percentage of households with no vehicle available in the United States with a correlation coefficient (R) of -0.022 and weighted average of 10.1%, a difference of 3.4%.
No Vehicles in Household Correlation Summary
| Measurement | Immigrants from Sudan | Salvadoran |
| Minimum | 0.089% | 1.3% |
| Maximum | 86.7% | 25.9% |
| Range | 86.6% | 24.7% |
| Mean | 10.0% | 9.9% |
| Median | 8.3% | 8.9% |
| Interquartile 25% (IQ1) | 5.6% | 7.1% |
| Interquartile 75% (IQ3) | 10.5% | 12.2% |
| Interquartile Range (IQR) | 5.0% | 5.1% |
| Standard Deviation (Sample) | 11.8% | 4.8% |
| Standard Deviation (Population) | 11.7% | 4.8% |
Demographics Similar to Immigrants from Sudan and Salvadorans by No Vehicles in Household
In terms of no vehicles in household, the demographic groups most similar to Immigrants from Sudan are Filipino (10.4%, a difference of 0.010%), Brazilian (10.4%, a difference of 0.23%), Hmong (10.4%, a difference of 0.37%), Immigrants from Latin America (10.4%, a difference of 0.43%), and Lumbee (10.3%, a difference of 0.65%). Similarly, the demographic groups most similar to Salvadorans are Sioux (10.1%, a difference of 0.010%), Immigrants from Micronesia (10.1%, a difference of 0.25%), Australian (10.1%, a difference of 0.30%), Spanish American Indian (10.1%, a difference of 0.36%), and Immigrants from Indonesia (10.1%, a difference of 0.51%).
| Demographics | Rating | Rank | No Vehicles in Household |
| Sioux | 72.4 /100 | #154 | Good 10.1% |
| Salvadorans | 72.4 /100 | #155 | Good 10.1% |
| Immigrants | Micronesia | 70.9 /100 | #156 | Good 10.1% |
| Australians | 70.6 /100 | #157 | Good 10.1% |
| Spanish American Indians | 70.2 /100 | #158 | Good 10.1% |
| Immigrants | Indonesia | 69.3 /100 | #159 | Good 10.1% |
| Immigrants | Middle Africa | 65.7 /100 | #160 | Good 10.2% |
| New Zealanders | 65.1 /100 | #161 | Good 10.2% |
| Immigrants | Austria | 64.4 /100 | #162 | Good 10.2% |
| Immigrants | Cambodia | 63.7 /100 | #163 | Good 10.2% |
| South Africans | 61.1 /100 | #164 | Good 10.2% |
| Comanche | 60.8 /100 | #165 | Good 10.2% |
| Immigrants | Costa Rica | 60.5 /100 | #166 | Good 10.3% |
| Immigrants | Saudi Arabia | 58.8 /100 | #167 | Average 10.3% |
| Indonesians | 56.7 /100 | #168 | Average 10.3% |
| Lumbee | 54.7 /100 | #169 | Average 10.3% |
| Immigrants | Latin America | 53.2 /100 | #170 | Average 10.4% |
| Hmong | 52.7 /100 | #171 | Average 10.4% |
| Brazilians | 51.7 /100 | #172 | Average 10.4% |
| Filipinos | 50.1 /100 | #173 | Average 10.4% |
| Immigrants | Sudan | 50.0 /100 | #174 | Average 10.4% |