Immigrants from Sudan vs Bolivian No Vehicles in Household
COMPARE
Immigrants from Sudan
Bolivian
No Vehicles in Household
No Vehicles in Household Comparison
Immigrants from Sudan
Bolivians
10.4%
NO VEHICLES IN HOUSEHOLD
50.0/ 100
METRIC RATING
174th/ 347
METRIC RANK
8.6%
NO VEHICLES IN HOUSEHOLD
99.4/ 100
METRIC RATING
80th/ 347
METRIC RANK
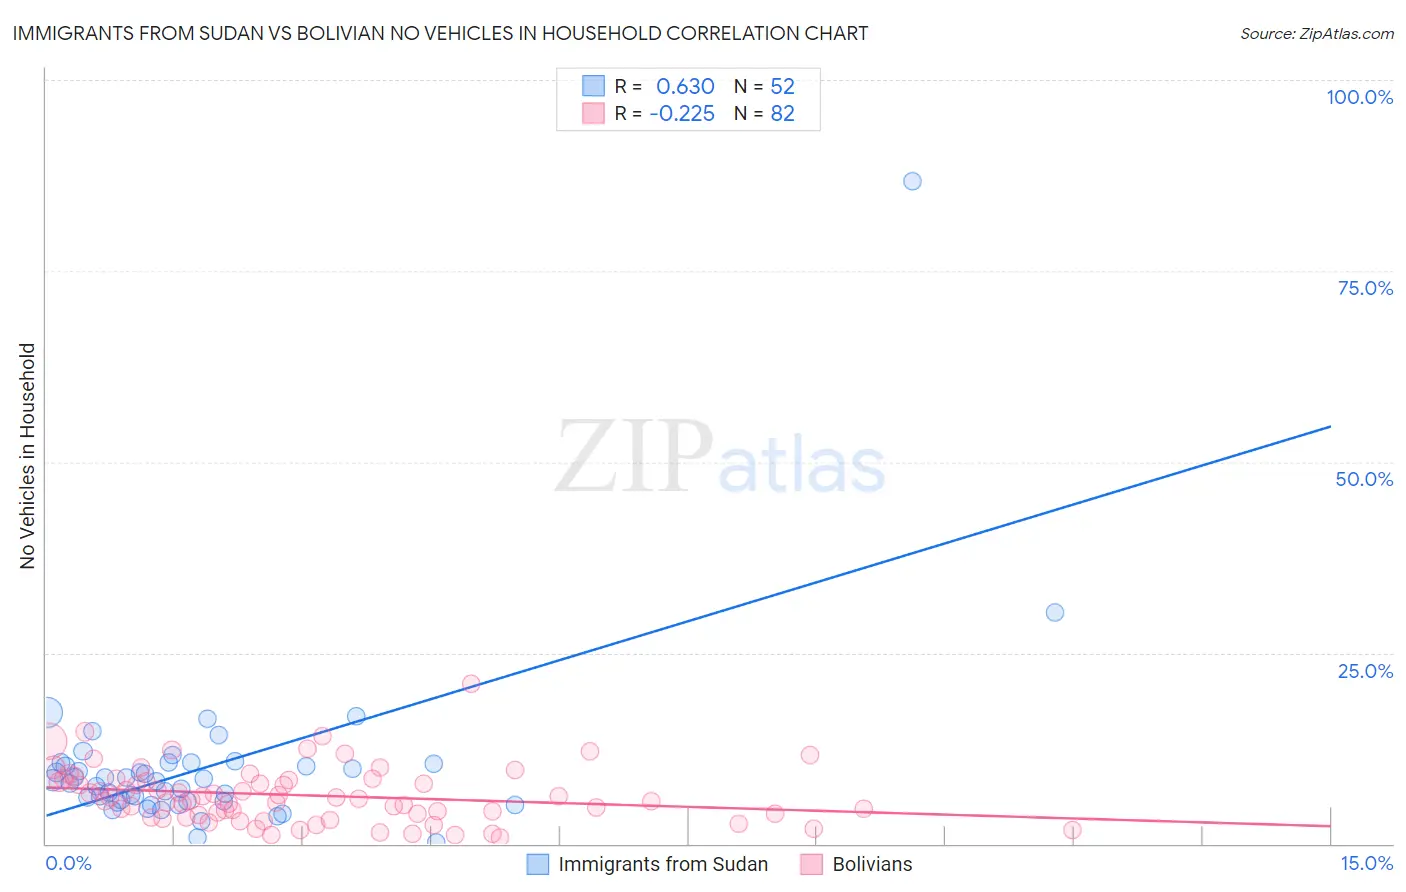
Immigrants from Sudan vs Bolivian No Vehicles in Household Correlation Chart
The statistical analysis conducted on geographies consisting of 118,914,710 people shows a significant positive correlation between the proportion of Immigrants from Sudan and percentage of households with no vehicle available in the United States with a correlation coefficient (R) of 0.630 and weighted average of 10.4%. Similarly, the statistical analysis conducted on geographies consisting of 184,519,669 people shows a weak negative correlation between the proportion of Bolivians and percentage of households with no vehicle available in the United States with a correlation coefficient (R) of -0.225 and weighted average of 8.6%, a difference of 21.2%.
No Vehicles in Household Correlation Summary
| Measurement | Immigrants from Sudan | Bolivian |
| Minimum | 0.089% | 0.83% |
| Maximum | 86.7% | 21.0% |
| Range | 86.6% | 20.2% |
| Mean | 10.0% | 6.3% |
| Median | 8.3% | 5.8% |
| Interquartile 25% (IQ1) | 5.6% | 3.7% |
| Interquartile 75% (IQ3) | 10.5% | 8.4% |
| Interquartile Range (IQR) | 5.0% | 4.6% |
| Standard Deviation (Sample) | 11.8% | 3.7% |
| Standard Deviation (Population) | 11.7% | 3.7% |
Similar Demographics by No Vehicles in Household
Demographics Similar to Immigrants from Sudan by No Vehicles in Household
In terms of no vehicles in household, the demographic groups most similar to Immigrants from Sudan are Filipino (10.4%, a difference of 0.010%), Immigrants from Burma/Myanmar (10.4%, a difference of 0.12%), French American Indian (10.4%, a difference of 0.12%), Immigrants from El Salvador (10.4%, a difference of 0.13%), and Brazilian (10.4%, a difference of 0.23%).
| Demographics | Rating | Rank | No Vehicles in Household |
| Immigrants | Saudi Arabia | 58.8 /100 | #167 | Average 10.3% |
| Indonesians | 56.7 /100 | #168 | Average 10.3% |
| Lumbee | 54.7 /100 | #169 | Average 10.3% |
| Immigrants | Latin America | 53.2 /100 | #170 | Average 10.4% |
| Hmong | 52.7 /100 | #171 | Average 10.4% |
| Brazilians | 51.7 /100 | #172 | Average 10.4% |
| Filipinos | 50.1 /100 | #173 | Average 10.4% |
| Immigrants | Sudan | 50.0 /100 | #174 | Average 10.4% |
| Immigrants | Burma/Myanmar | 49.1 /100 | #175 | Average 10.4% |
| French American Indians | 49.1 /100 | #176 | Average 10.4% |
| Immigrants | El Salvador | 49.1 /100 | #177 | Average 10.4% |
| Immigrants | Ethiopia | 48.0 /100 | #178 | Average 10.4% |
| Ethiopians | 45.8 /100 | #179 | Average 10.5% |
| Arabs | 45.3 /100 | #180 | Average 10.5% |
| Immigrants | Colombia | 44.1 /100 | #181 | Average 10.5% |
Demographics Similar to Bolivians by No Vehicles in Household
In terms of no vehicles in household, the demographic groups most similar to Bolivians are Tsimshian (8.6%, a difference of 0.050%), Portuguese (8.6%, a difference of 0.15%), Immigrants from South Eastern Asia (8.6%, a difference of 0.18%), Immigrants from South Central Asia (8.6%, a difference of 0.20%), and Iranian (8.6%, a difference of 0.32%).
| Demographics | Rating | Rank | No Vehicles in Household |
| Poles | 99.6 /100 | #73 | Exceptional 8.4% |
| Cubans | 99.5 /100 | #74 | Exceptional 8.5% |
| Jordanians | 99.5 /100 | #75 | Exceptional 8.5% |
| Immigrants | Philippines | 99.5 /100 | #76 | Exceptional 8.5% |
| Iranians | 99.5 /100 | #77 | Exceptional 8.6% |
| Immigrants | South Central Asia | 99.5 /100 | #78 | Exceptional 8.6% |
| Portuguese | 99.5 /100 | #79 | Exceptional 8.6% |
| Bolivians | 99.4 /100 | #80 | Exceptional 8.6% |
| Tsimshian | 99.4 /100 | #81 | Exceptional 8.6% |
| Immigrants | South Eastern Asia | 99.4 /100 | #82 | Exceptional 8.6% |
| Italians | 99.4 /100 | #83 | Exceptional 8.6% |
| Immigrants | Jordan | 99.3 /100 | #84 | Exceptional 8.7% |
| Lebanese | 99.3 /100 | #85 | Exceptional 8.7% |
| Bangladeshis | 99.3 /100 | #86 | Exceptional 8.7% |
| Immigrants | England | 99.2 /100 | #87 | Exceptional 8.7% |