Immigrants from Sudan vs Immigrants from Argentina No Vehicles in Household
COMPARE
Immigrants from Sudan
Immigrants from Argentina
No Vehicles in Household
No Vehicles in Household Comparison
Immigrants from Sudan
Immigrants from Argentina
10.4%
NO VEHICLES IN HOUSEHOLD
50.0/ 100
METRIC RATING
174th/ 347
METRIC RANK
11.2%
NO VEHICLES IN HOUSEHOLD
10.6/ 100
METRIC RATING
216th/ 347
METRIC RANK
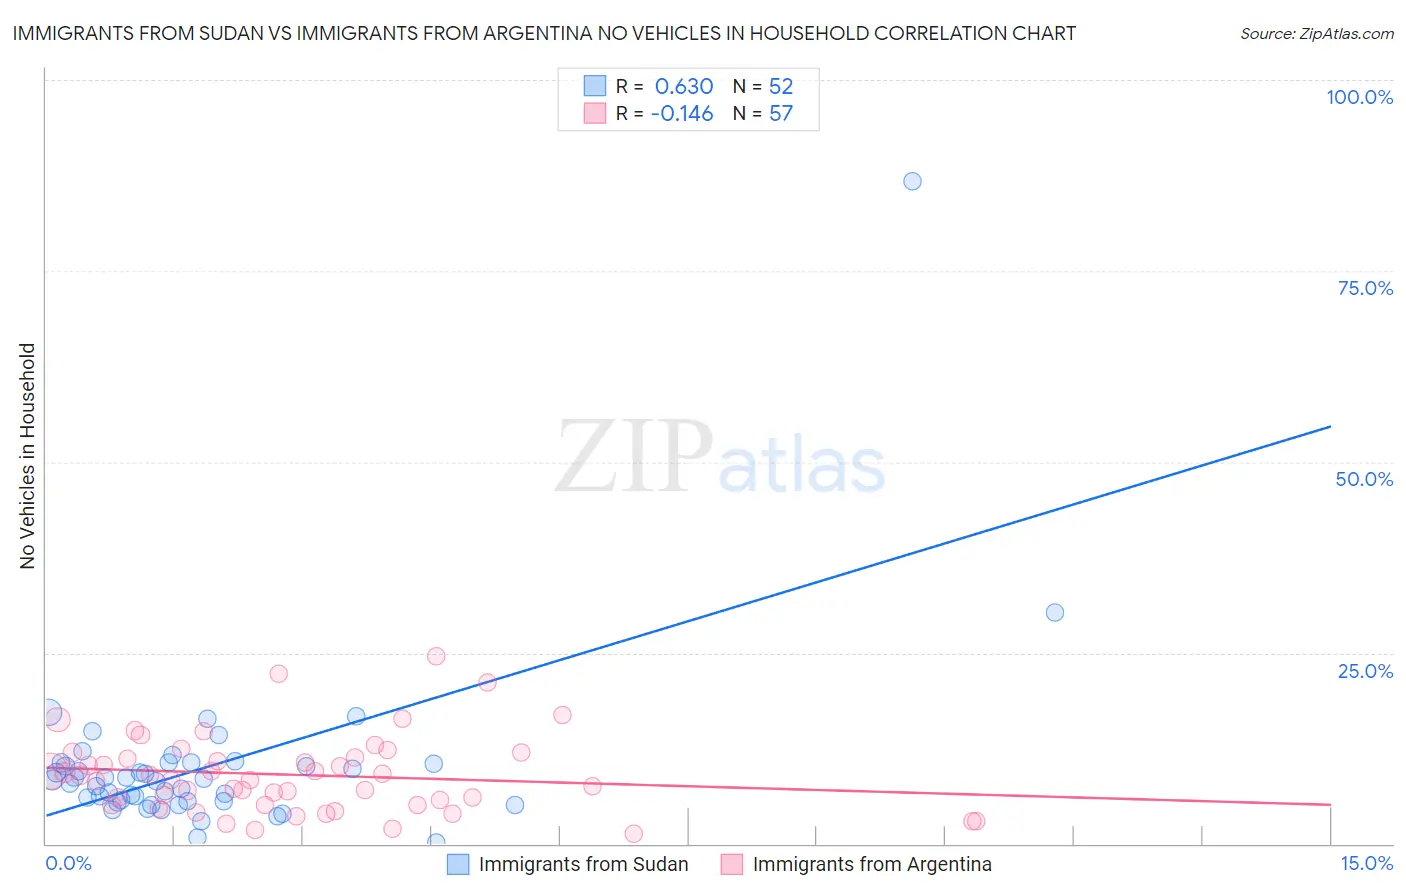
Immigrants from Sudan vs Immigrants from Argentina No Vehicles in Household Correlation Chart
The statistical analysis conducted on geographies consisting of 118,914,710 people shows a significant positive correlation between the proportion of Immigrants from Sudan and percentage of households with no vehicle available in the United States with a correlation coefficient (R) of 0.630 and weighted average of 10.4%. Similarly, the statistical analysis conducted on geographies consisting of 264,127,238 people shows a poor negative correlation between the proportion of Immigrants from Argentina and percentage of households with no vehicle available in the United States with a correlation coefficient (R) of -0.146 and weighted average of 11.2%, a difference of 7.2%.
No Vehicles in Household Correlation Summary
| Measurement | Immigrants from Sudan | Immigrants from Argentina |
| Minimum | 0.089% | 1.2% |
| Maximum | 86.7% | 24.6% |
| Range | 86.6% | 23.3% |
| Mean | 10.0% | 9.0% |
| Median | 8.3% | 8.4% |
| Interquartile 25% (IQ1) | 5.6% | 5.1% |
| Interquartile 75% (IQ3) | 10.5% | 11.6% |
| Interquartile Range (IQR) | 5.0% | 6.6% |
| Standard Deviation (Sample) | 11.8% | 5.1% |
| Standard Deviation (Population) | 11.7% | 5.0% |
Similar Demographics by No Vehicles in Household
Demographics Similar to Immigrants from Sudan by No Vehicles in Household
In terms of no vehicles in household, the demographic groups most similar to Immigrants from Sudan are Filipino (10.4%, a difference of 0.010%), Immigrants from Burma/Myanmar (10.4%, a difference of 0.12%), French American Indian (10.4%, a difference of 0.12%), Immigrants from El Salvador (10.4%, a difference of 0.13%), and Brazilian (10.4%, a difference of 0.23%).
| Demographics | Rating | Rank | No Vehicles in Household |
| Immigrants | Saudi Arabia | 58.8 /100 | #167 | Average 10.3% |
| Indonesians | 56.7 /100 | #168 | Average 10.3% |
| Lumbee | 54.7 /100 | #169 | Average 10.3% |
| Immigrants | Latin America | 53.2 /100 | #170 | Average 10.4% |
| Hmong | 52.7 /100 | #171 | Average 10.4% |
| Brazilians | 51.7 /100 | #172 | Average 10.4% |
| Filipinos | 50.1 /100 | #173 | Average 10.4% |
| Immigrants | Sudan | 50.0 /100 | #174 | Average 10.4% |
| Immigrants | Burma/Myanmar | 49.1 /100 | #175 | Average 10.4% |
| French American Indians | 49.1 /100 | #176 | Average 10.4% |
| Immigrants | El Salvador | 49.1 /100 | #177 | Average 10.4% |
| Immigrants | Ethiopia | 48.0 /100 | #178 | Average 10.4% |
| Ethiopians | 45.8 /100 | #179 | Average 10.5% |
| Arabs | 45.3 /100 | #180 | Average 10.5% |
| Immigrants | Colombia | 44.1 /100 | #181 | Average 10.5% |
Demographics Similar to Immigrants from Argentina by No Vehicles in Household
In terms of no vehicles in household, the demographic groups most similar to Immigrants from Argentina are Immigrants from Sri Lanka (11.2%, a difference of 0.0%), Dutch West Indian (11.2%, a difference of 0.12%), Immigrants from Guatemala (11.2%, a difference of 0.22%), Argentinean (11.2%, a difference of 0.35%), and Immigrants from Zaire (11.2%, a difference of 0.36%).
| Demographics | Rating | Rank | No Vehicles in Household |
| Pennsylvania Germans | 15.5 /100 | #209 | Poor 11.0% |
| Apache | 14.8 /100 | #210 | Poor 11.0% |
| Crow | 14.2 /100 | #211 | Poor 11.0% |
| Immigrants | Western Asia | 13.9 /100 | #212 | Poor 11.0% |
| Immigrants | Hungary | 12.3 /100 | #213 | Poor 11.1% |
| Immigrants | Denmark | 12.1 /100 | #214 | Poor 11.1% |
| Immigrants | Sri Lanka | 10.6 /100 | #215 | Poor 11.2% |
| Immigrants | Argentina | 10.6 /100 | #216 | Poor 11.2% |
| Dutch West Indians | 10.2 /100 | #217 | Poor 11.2% |
| Immigrants | Guatemala | 10.0 /100 | #218 | Tragic 11.2% |
| Argentineans | 9.6 /100 | #219 | Tragic 11.2% |
| Immigrants | Zaire | 9.6 /100 | #220 | Tragic 11.2% |
| Peruvians | 8.4 /100 | #221 | Tragic 11.2% |
| Immigrants | South America | 8.0 /100 | #222 | Tragic 11.3% |
| Uruguayans | 7.7 /100 | #223 | Tragic 11.3% |