Immigrants from South America vs Salvadoran No Vehicles in Household
COMPARE
Immigrants from South America
Salvadoran
No Vehicles in Household
No Vehicles in Household Comparison
Immigrants from South America
Salvadorans
11.3%
NO VEHICLES IN HOUSEHOLD
8.0/ 100
METRIC RATING
222nd/ 347
METRIC RANK
10.1%
NO VEHICLES IN HOUSEHOLD
72.4/ 100
METRIC RATING
155th/ 347
METRIC RANK
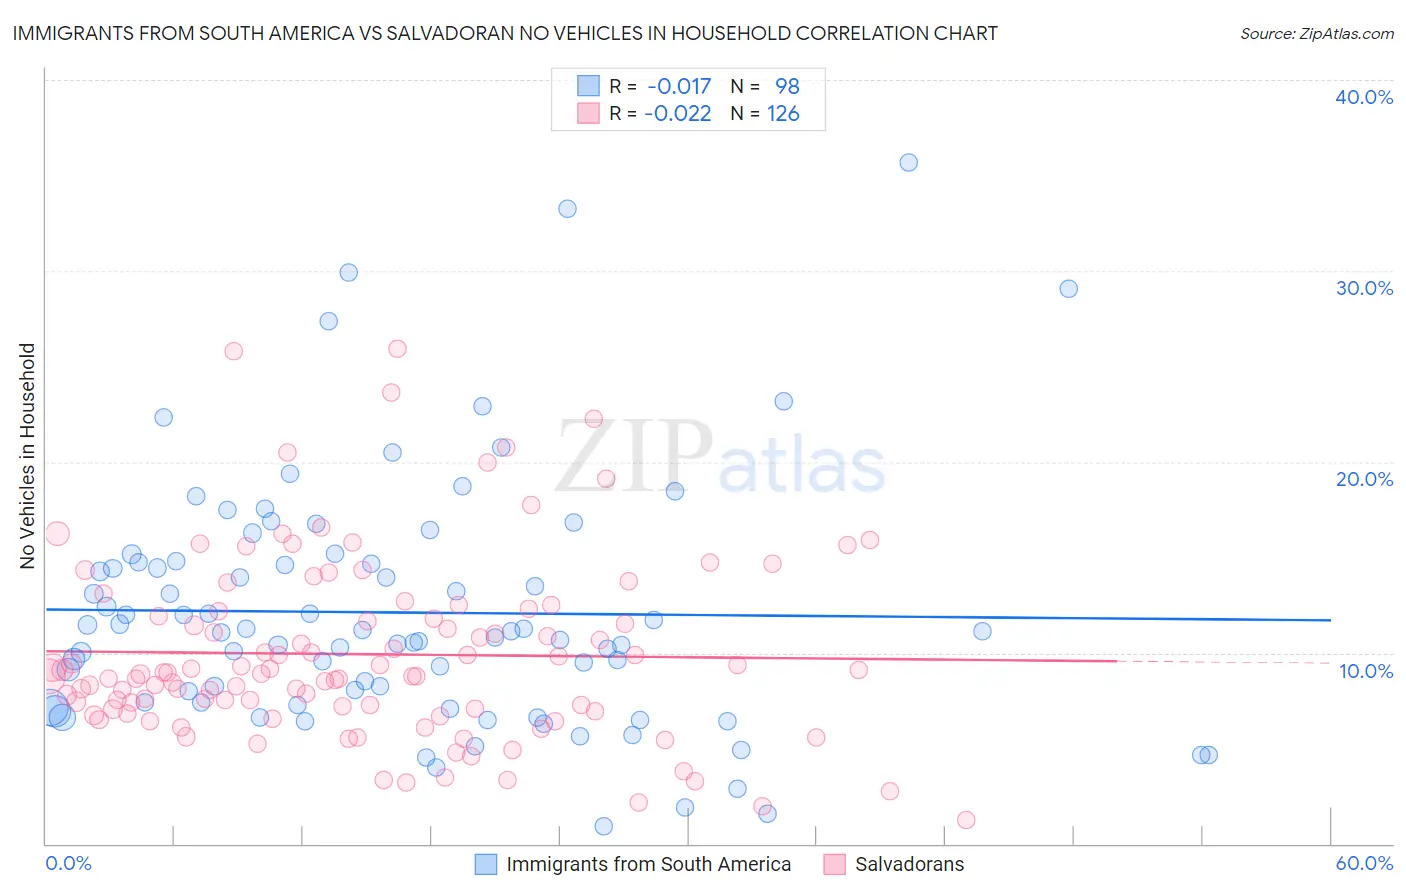
Immigrants from South America vs Salvadoran No Vehicles in Household Correlation Chart
The statistical analysis conducted on geographies consisting of 474,331,452 people shows no correlation between the proportion of Immigrants from South America and percentage of households with no vehicle available in the United States with a correlation coefficient (R) of -0.017 and weighted average of 11.3%. Similarly, the statistical analysis conducted on geographies consisting of 397,977,733 people shows no correlation between the proportion of Salvadorans and percentage of households with no vehicle available in the United States with a correlation coefficient (R) of -0.022 and weighted average of 10.1%, a difference of 11.9%.
No Vehicles in Household Correlation Summary
| Measurement | Immigrants from South America | Salvadoran |
| Minimum | 0.90% | 1.3% |
| Maximum | 35.7% | 25.9% |
| Range | 34.8% | 24.7% |
| Mean | 12.1% | 9.9% |
| Median | 11.1% | 8.9% |
| Interquartile 25% (IQ1) | 7.4% | 7.1% |
| Interquartile 75% (IQ3) | 14.7% | 12.2% |
| Interquartile Range (IQR) | 7.3% | 5.1% |
| Standard Deviation (Sample) | 6.5% | 4.8% |
| Standard Deviation (Population) | 6.5% | 4.8% |
Similar Demographics by No Vehicles in Household
Demographics Similar to Immigrants from South America by No Vehicles in Household
In terms of no vehicles in household, the demographic groups most similar to Immigrants from South America are Peruvian (11.2%, a difference of 0.15%), Uruguayan (11.3%, a difference of 0.16%), Immigrants from Hong Kong (11.3%, a difference of 0.38%), Immigrants from Zaire (11.2%, a difference of 0.60%), and Argentinean (11.2%, a difference of 0.61%).
| Demographics | Rating | Rank | No Vehicles in Household |
| Immigrants | Sri Lanka | 10.6 /100 | #215 | Poor 11.2% |
| Immigrants | Argentina | 10.6 /100 | #216 | Poor 11.2% |
| Dutch West Indians | 10.2 /100 | #217 | Poor 11.2% |
| Immigrants | Guatemala | 10.0 /100 | #218 | Tragic 11.2% |
| Argentineans | 9.6 /100 | #219 | Tragic 11.2% |
| Immigrants | Zaire | 9.6 /100 | #220 | Tragic 11.2% |
| Peruvians | 8.4 /100 | #221 | Tragic 11.2% |
| Immigrants | South America | 8.0 /100 | #222 | Tragic 11.3% |
| Uruguayans | 7.7 /100 | #223 | Tragic 11.3% |
| Immigrants | Hong Kong | 7.2 /100 | #224 | Tragic 11.3% |
| Immigrants | Sierra Leone | 6.4 /100 | #225 | Tragic 11.3% |
| Immigrants | Somalia | 5.4 /100 | #226 | Tragic 11.4% |
| Immigrants | Pakistan | 5.4 /100 | #227 | Tragic 11.4% |
| Immigrants | Romania | 5.3 /100 | #228 | Tragic 11.4% |
| Ugandans | 5.3 /100 | #229 | Tragic 11.4% |
Demographics Similar to Salvadorans by No Vehicles in Household
In terms of no vehicles in household, the demographic groups most similar to Salvadorans are Sioux (10.1%, a difference of 0.010%), Tlingit-Haida (10.1%, a difference of 0.030%), Immigrants from Congo (10.1%, a difference of 0.12%), Immigrants from Micronesia (10.1%, a difference of 0.25%), and Immigrants from Eastern Africa (10.0%, a difference of 0.26%).
| Demographics | Rating | Rank | No Vehicles in Household |
| Immigrants | Bosnia and Herzegovina | 79.1 /100 | #148 | Good 9.9% |
| Immigrants | Uganda | 76.1 /100 | #149 | Good 10.0% |
| Colombians | 73.9 /100 | #150 | Good 10.0% |
| Immigrants | Eastern Africa | 73.8 /100 | #151 | Good 10.0% |
| Immigrants | Congo | 73.0 /100 | #152 | Good 10.1% |
| Tlingit-Haida | 72.5 /100 | #153 | Good 10.1% |
| Sioux | 72.4 /100 | #154 | Good 10.1% |
| Salvadorans | 72.4 /100 | #155 | Good 10.1% |
| Immigrants | Micronesia | 70.9 /100 | #156 | Good 10.1% |
| Australians | 70.6 /100 | #157 | Good 10.1% |
| Spanish American Indians | 70.2 /100 | #158 | Good 10.1% |
| Immigrants | Indonesia | 69.3 /100 | #159 | Good 10.1% |
| Immigrants | Middle Africa | 65.7 /100 | #160 | Good 10.2% |
| New Zealanders | 65.1 /100 | #161 | Good 10.2% |
| Immigrants | Austria | 64.4 /100 | #162 | Good 10.2% |