Immigrants from Southern Europe vs Tsimshian 4 or more Vehicles in Household
COMPARE
Immigrants from Southern Europe
Tsimshian
4 or more Vehicles in Household
4 or more Vehicles in Household Comparison
Immigrants from Southern Europe
Tsimshian
5.7%
4 OR MORE VEHICLES IN HOUSEHOLD
2.3/ 100
METRIC RATING
249th/ 347
METRIC RANK
6.2%
4 OR MORE VEHICLES IN HOUSEHOLD
26.4/ 100
METRIC RATING
196th/ 347
METRIC RANK
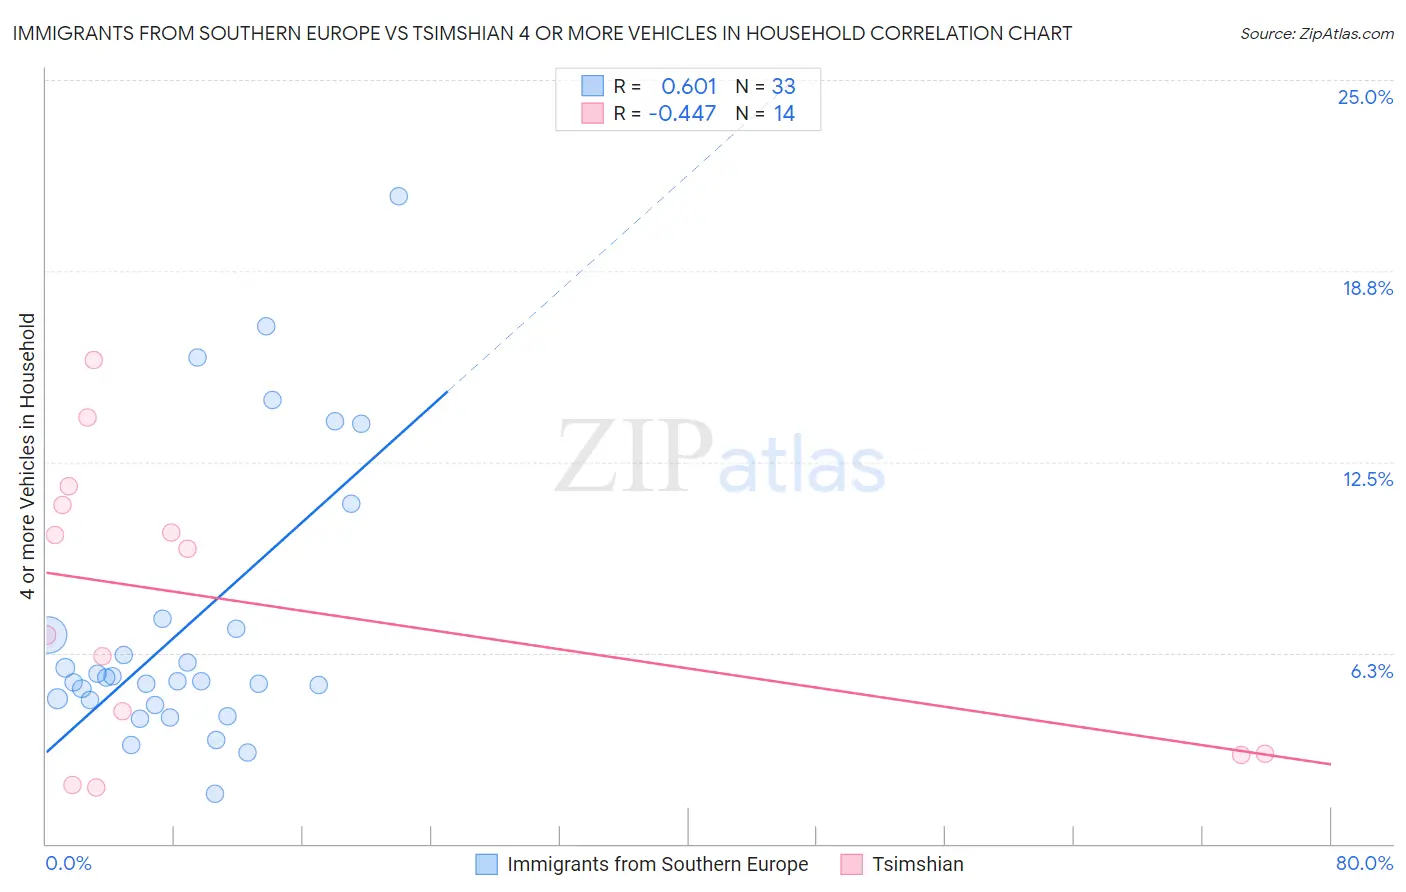
Immigrants from Southern Europe vs Tsimshian 4 or more Vehicles in Household Correlation Chart
The statistical analysis conducted on geographies consisting of 400,794,639 people shows a significant positive correlation between the proportion of Immigrants from Southern Europe and percentage of households with 4 or more vehicles available in the United States with a correlation coefficient (R) of 0.601 and weighted average of 5.7%. Similarly, the statistical analysis conducted on geographies consisting of 15,625,888 people shows a moderate negative correlation between the proportion of Tsimshian and percentage of households with 4 or more vehicles available in the United States with a correlation coefficient (R) of -0.447 and weighted average of 6.2%, a difference of 7.6%.
4 or more Vehicles in Household Correlation Summary
| Measurement | Immigrants from Southern Europe | Tsimshian |
| Minimum | 1.6% | 1.9% |
| Maximum | 21.2% | 15.8% |
| Range | 19.6% | 14.0% |
| Mean | 7.2% | 7.8% |
| Median | 5.3% | 8.2% |
| Interquartile 25% (IQ1) | 4.6% | 2.9% |
| Interquartile 75% (IQ3) | 7.2% | 11.1% |
| Interquartile Range (IQR) | 2.6% | 8.2% |
| Standard Deviation (Sample) | 4.6% | 4.6% |
| Standard Deviation (Population) | 4.6% | 4.4% |
Similar Demographics by 4 or more Vehicles in Household
Demographics Similar to Immigrants from Southern Europe by 4 or more Vehicles in Household
In terms of 4 or more vehicles in household, the demographic groups most similar to Immigrants from Southern Europe are Immigrants from Eastern Africa (5.7%, a difference of 0.020%), Immigrants from Europe (5.7%, a difference of 0.10%), Ugandan (5.7%, a difference of 0.12%), Immigrants from Ethiopia (5.7%, a difference of 0.13%), and Immigrants from North Macedonia (5.7%, a difference of 0.16%).
| Demographics | Rating | Rank | 4 or more Vehicles in Household |
| Immigrants | Middle Africa | 3.4 /100 | #242 | Tragic 5.8% |
| Immigrants | Czechoslovakia | 3.2 /100 | #243 | Tragic 5.8% |
| Ethiopians | 3.2 /100 | #244 | Tragic 5.8% |
| Bulgarians | 3.1 /100 | #245 | Tragic 5.8% |
| Immigrants | North Macedonia | 2.5 /100 | #246 | Tragic 5.7% |
| Immigrants | Ethiopia | 2.4 /100 | #247 | Tragic 5.7% |
| Immigrants | Eastern Africa | 2.4 /100 | #248 | Tragic 5.7% |
| Immigrants | Southern Europe | 2.3 /100 | #249 | Tragic 5.7% |
| Immigrants | Europe | 2.3 /100 | #250 | Tragic 5.7% |
| Ugandans | 2.2 /100 | #251 | Tragic 5.7% |
| Sub-Saharan Africans | 2.1 /100 | #252 | Tragic 5.7% |
| Immigrants | Cuba | 1.6 /100 | #253 | Tragic 5.7% |
| Immigrants | Panama | 1.5 /100 | #254 | Tragic 5.7% |
| Yup'ik | 1.5 /100 | #255 | Tragic 5.7% |
| Immigrants | Turkey | 1.5 /100 | #256 | Tragic 5.7% |
Demographics Similar to Tsimshian by 4 or more Vehicles in Household
In terms of 4 or more vehicles in household, the demographic groups most similar to Tsimshian are Immigrants from Sweden (6.2%, a difference of 0.070%), Argentinean (6.2%, a difference of 0.070%), Immigrants from Kuwait (6.2%, a difference of 0.20%), Immigrants from Sri Lanka (6.1%, a difference of 0.38%), and Romanian (6.2%, a difference of 0.54%).
| Demographics | Rating | Rank | 4 or more Vehicles in Household |
| Immigrants | Eastern Asia | 33.3 /100 | #189 | Fair 6.2% |
| South Africans | 32.2 /100 | #190 | Fair 6.2% |
| Inupiat | 30.7 /100 | #191 | Fair 6.2% |
| Romanians | 30.7 /100 | #192 | Fair 6.2% |
| Immigrants | Kuwait | 28.0 /100 | #193 | Fair 6.2% |
| Immigrants | Sweden | 27.0 /100 | #194 | Fair 6.2% |
| Argentineans | 27.0 /100 | #195 | Fair 6.2% |
| Tsimshian | 26.4 /100 | #196 | Fair 6.2% |
| Immigrants | Sri Lanka | 23.7 /100 | #197 | Fair 6.1% |
| Immigrants | Portugal | 22.3 /100 | #198 | Fair 6.1% |
| Immigrants | Norway | 21.8 /100 | #199 | Fair 6.1% |
| Latvians | 21.7 /100 | #200 | Fair 6.1% |
| Egyptians | 21.4 /100 | #201 | Fair 6.1% |
| Immigrants | South Central Asia | 21.3 /100 | #202 | Fair 6.1% |
| Immigrants | Sierra Leone | 20.5 /100 | #203 | Fair 6.1% |