Immigrants from South Eastern Asia vs U.S. Virgin Islander 4 or more Vehicles in Household
COMPARE
Immigrants from South Eastern Asia
U.S. Virgin Islander
4 or more Vehicles in Household
4 or more Vehicles in Household Comparison
Immigrants from South Eastern Asia
U.S. Virgin Islanders
8.2%
4 OR MORE VEHICLES IN HOUSEHOLD
100.0/ 100
METRIC RATING
29th/ 347
METRIC RANK
4.6%
4 OR MORE VEHICLES IN HOUSEHOLD
0.0/ 100
METRIC RATING
317th/ 347
METRIC RANK
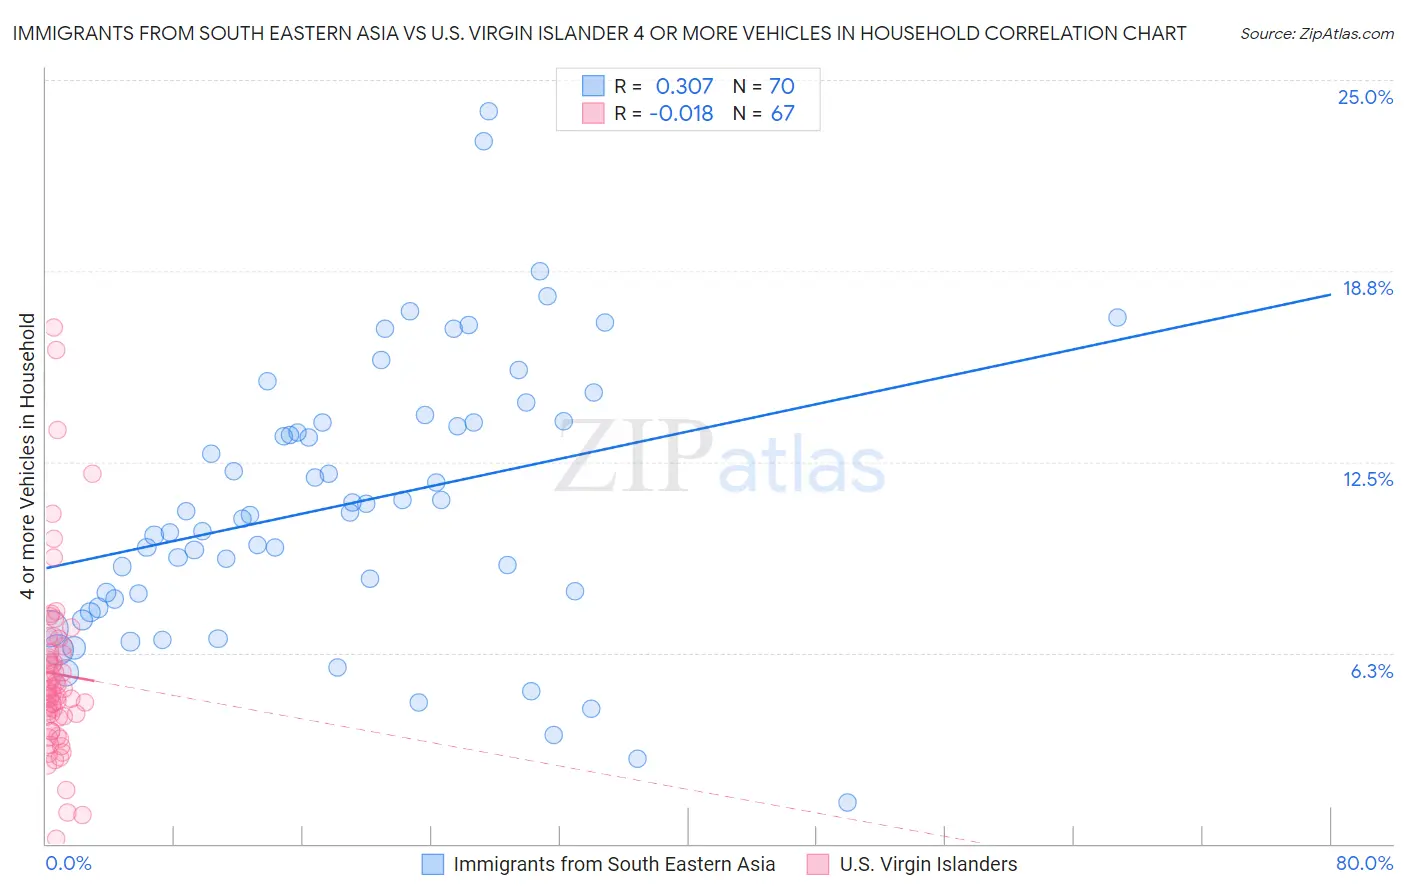
Immigrants from South Eastern Asia vs U.S. Virgin Islander 4 or more Vehicles in Household Correlation Chart
The statistical analysis conducted on geographies consisting of 510,087,728 people shows a mild positive correlation between the proportion of Immigrants from South Eastern Asia and percentage of households with 4 or more vehicles available in the United States with a correlation coefficient (R) of 0.307 and weighted average of 8.2%. Similarly, the statistical analysis conducted on geographies consisting of 87,207,044 people shows no correlation between the proportion of U.S. Virgin Islanders and percentage of households with 4 or more vehicles available in the United States with a correlation coefficient (R) of -0.018 and weighted average of 4.6%, a difference of 77.2%.
4 or more Vehicles in Household Correlation Summary
| Measurement | Immigrants from South Eastern Asia | U.S. Virgin Islander |
| Minimum | 1.4% | 0.17% |
| Maximum | 24.0% | 16.9% |
| Range | 22.6% | 16.7% |
| Mean | 11.1% | 5.6% |
| Median | 10.8% | 5.0% |
| Interquartile 25% (IQ1) | 8.0% | 4.2% |
| Interquartile 75% (IQ3) | 13.8% | 6.3% |
| Interquartile Range (IQR) | 5.8% | 2.1% |
| Standard Deviation (Sample) | 4.5% | 3.0% |
| Standard Deviation (Population) | 4.5% | 3.0% |
Similar Demographics by 4 or more Vehicles in Household
Demographics Similar to Immigrants from South Eastern Asia by 4 or more Vehicles in Household
In terms of 4 or more vehicles in household, the demographic groups most similar to Immigrants from South Eastern Asia are Navajo (8.2%, a difference of 0.030%), Native/Alaskan (8.2%, a difference of 0.43%), Cheyenne (8.3%, a difference of 0.66%), Marshallese (8.1%, a difference of 0.97%), and Yaqui (8.1%, a difference of 1.3%).
| Demographics | Rating | Rank | 4 or more Vehicles in Household |
| Immigrants | Vietnam | 100.0 /100 | #22 | Exceptional 8.6% |
| Immigrants | Philippines | 100.0 /100 | #23 | Exceptional 8.5% |
| Immigrants | Central America | 100.0 /100 | #24 | Exceptional 8.5% |
| Basques | 100.0 /100 | #25 | Exceptional 8.4% |
| Mexican American Indians | 100.0 /100 | #26 | Exceptional 8.4% |
| Sri Lankans | 100.0 /100 | #27 | Exceptional 8.4% |
| Cheyenne | 100.0 /100 | #28 | Exceptional 8.3% |
| Immigrants | South Eastern Asia | 100.0 /100 | #29 | Exceptional 8.2% |
| Navajo | 100.0 /100 | #30 | Exceptional 8.2% |
| Natives/Alaskans | 100.0 /100 | #31 | Exceptional 8.2% |
| Marshallese | 100.0 /100 | #32 | Exceptional 8.1% |
| Yaqui | 100.0 /100 | #33 | Exceptional 8.1% |
| Alaskan Athabascans | 100.0 /100 | #34 | Exceptional 8.1% |
| Guamanians/Chamorros | 100.0 /100 | #35 | Exceptional 8.1% |
| Norwegians | 100.0 /100 | #36 | Exceptional 8.0% |
Demographics Similar to U.S. Virgin Islanders by 4 or more Vehicles in Household
In terms of 4 or more vehicles in household, the demographic groups most similar to U.S. Virgin Islanders are Jamaican (4.6%, a difference of 0.24%), Haitian (4.6%, a difference of 0.89%), Puerto Rican (4.7%, a difference of 1.7%), Immigrants from Belarus (4.7%, a difference of 2.1%), and Immigrants from West Indies (4.7%, a difference of 2.2%).
| Demographics | Rating | Rank | 4 or more Vehicles in Household |
| Moroccans | 0.0 /100 | #310 | Tragic 4.9% |
| Houma | 0.0 /100 | #311 | Tragic 4.9% |
| Albanians | 0.0 /100 | #312 | Tragic 4.8% |
| Immigrants | Israel | 0.0 /100 | #313 | Tragic 4.8% |
| Immigrants | West Indies | 0.0 /100 | #314 | Tragic 4.7% |
| Immigrants | Belarus | 0.0 /100 | #315 | Tragic 4.7% |
| Puerto Ricans | 0.0 /100 | #316 | Tragic 4.7% |
| U.S. Virgin Islanders | 0.0 /100 | #317 | Tragic 4.6% |
| Jamaicans | 0.0 /100 | #318 | Tragic 4.6% |
| Haitians | 0.0 /100 | #319 | Tragic 4.6% |
| Immigrants | Haiti | 0.0 /100 | #320 | Tragic 4.5% |
| Ecuadorians | 0.0 /100 | #321 | Tragic 4.5% |
| Immigrants | Yemen | 0.0 /100 | #322 | Tragic 4.5% |
| Immigrants | Caribbean | 0.0 /100 | #323 | Tragic 4.4% |
| Soviet Union | 0.0 /100 | #324 | Tragic 4.4% |