Immigrants from South America vs Immigrants from Trinidad and Tobago 1 or more Vehicles in Household
COMPARE
Immigrants from South America
Immigrants from Trinidad and Tobago
1 or more Vehicles in Household
1 or more Vehicles in Household Comparison
Immigrants from South America
Immigrants from Trinidad and Tobago
88.8%
1 OR MORE VEHICLES IN HOUSEHOLD
7.0/ 100
METRIC RATING
223rd/ 347
METRIC RANK
76.8%
1 OR MORE VEHICLES IN HOUSEHOLD
0.0/ 100
METRIC RATING
330th/ 347
METRIC RANK
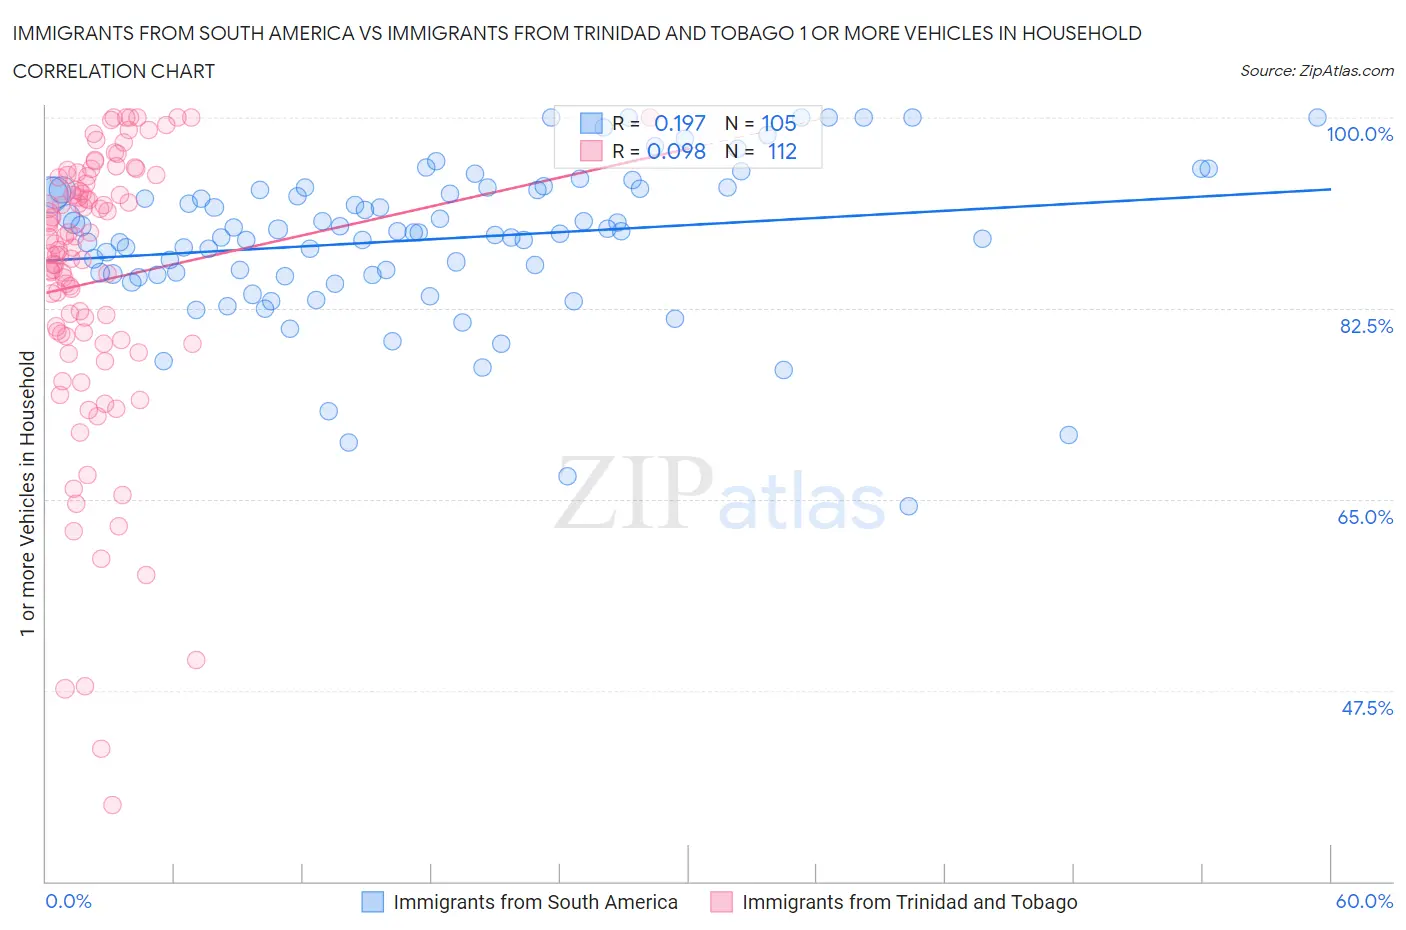
Immigrants from South America vs Immigrants from Trinidad and Tobago 1 or more Vehicles in Household Correlation Chart
The statistical analysis conducted on geographies consisting of 476,014,364 people shows a poor positive correlation between the proportion of Immigrants from South America and percentage of households with 1 or more vehicles available in the United States with a correlation coefficient (R) of 0.197 and weighted average of 88.8%. Similarly, the statistical analysis conducted on geographies consisting of 223,174,280 people shows a slight positive correlation between the proportion of Immigrants from Trinidad and Tobago and percentage of households with 1 or more vehicles available in the United States with a correlation coefficient (R) of 0.098 and weighted average of 76.8%, a difference of 15.6%.
1 or more Vehicles in Household Correlation Summary
| Measurement | Immigrants from South America | Immigrants from Trinidad and Tobago |
| Minimum | 64.3% | 37.0% |
| Maximum | 100.0% | 100.0% |
| Range | 35.7% | 63.0% |
| Mean | 88.8% | 84.9% |
| Median | 89.5% | 88.0% |
| Interquartile 25% (IQ1) | 85.6% | 79.7% |
| Interquartile 75% (IQ3) | 93.4% | 94.2% |
| Interquartile Range (IQR) | 7.8% | 14.5% |
| Standard Deviation (Sample) | 7.0% | 13.1% |
| Standard Deviation (Population) | 7.0% | 13.1% |
Similar Demographics by 1 or more Vehicles in Household
Demographics Similar to Immigrants from South America by 1 or more Vehicles in Household
In terms of 1 or more vehicles in household, the demographic groups most similar to Immigrants from South America are Uruguayan (88.8%, a difference of 0.0%), Peruvian (88.8%, a difference of 0.050%), Immigrants from Hong Kong (88.7%, a difference of 0.050%), Cree (88.7%, a difference of 0.060%), and Immigrants from Zaire (88.8%, a difference of 0.070%).
| Demographics | Rating | Rank | 1 or more Vehicles in Household |
| Immigrants | Argentina | 9.4 /100 | #216 | Tragic 88.9% |
| Argentineans | 8.8 /100 | #217 | Tragic 88.9% |
| Ugandans | 8.7 /100 | #218 | Tragic 88.9% |
| Immigrants | Guatemala | 8.6 /100 | #219 | Tragic 88.9% |
| Immigrants | Zaire | 8.1 /100 | #220 | Tragic 88.8% |
| Peruvians | 7.9 /100 | #221 | Tragic 88.8% |
| Uruguayans | 7.0 /100 | #222 | Tragic 88.8% |
| Immigrants | South America | 7.0 /100 | #223 | Tragic 88.8% |
| Immigrants | Hong Kong | 6.2 /100 | #224 | Tragic 88.7% |
| Cree | 6.0 /100 | #225 | Tragic 88.7% |
| Cheyenne | 5.7 /100 | #226 | Tragic 88.7% |
| Ute | 5.6 /100 | #227 | Tragic 88.7% |
| Immigrants | Norway | 5.5 /100 | #228 | Tragic 88.7% |
| Immigrants | Romania | 5.4 /100 | #229 | Tragic 88.7% |
| Immigrants | Sierra Leone | 5.2 /100 | #230 | Tragic 88.7% |
Demographics Similar to Immigrants from Trinidad and Tobago by 1 or more Vehicles in Household
In terms of 1 or more vehicles in household, the demographic groups most similar to Immigrants from Trinidad and Tobago are West Indian (76.4%, a difference of 0.55%), Trinidadian and Tobagonian (76.3%, a difference of 0.64%), Immigrants from Ecuador (76.2%, a difference of 0.73%), Immigrants from Dominica (77.8%, a difference of 1.4%), and Ecuadorian (77.9%, a difference of 1.5%).
| Demographics | Rating | Rank | 1 or more Vehicles in Household |
| Immigrants | Yemen | 0.0 /100 | #323 | Tragic 80.5% |
| Immigrants | Caribbean | 0.0 /100 | #324 | Tragic 80.4% |
| Senegalese | 0.0 /100 | #325 | Tragic 80.4% |
| Immigrants | West Indies | 0.0 /100 | #326 | Tragic 79.5% |
| Immigrants | Senegal | 0.0 /100 | #327 | Tragic 79.0% |
| Ecuadorians | 0.0 /100 | #328 | Tragic 77.9% |
| Immigrants | Dominica | 0.0 /100 | #329 | Tragic 77.8% |
| Immigrants | Trinidad and Tobago | 0.0 /100 | #330 | Tragic 76.8% |
| West Indians | 0.0 /100 | #331 | Tragic 76.4% |
| Trinidadians and Tobagonians | 0.0 /100 | #332 | Tragic 76.3% |
| Immigrants | Ecuador | 0.0 /100 | #333 | Tragic 76.2% |
| Immigrants | Bangladesh | 0.0 /100 | #334 | Tragic 74.3% |
| Barbadians | 0.0 /100 | #335 | Tragic 74.0% |
| Vietnamese | 0.0 /100 | #336 | Tragic 73.8% |
| Immigrants | Uzbekistan | 0.0 /100 | #337 | Tragic 73.4% |