Yaqui vs Guamanian/Chamorro No Vehicles in Household
COMPARE
Yaqui
Guamanian/Chamorro
No Vehicles in Household
No Vehicles in Household Comparison
Yaqui
Guamanians/Chamorros
7.5%
NO VEHICLES IN HOUSEHOLD
100.0/ 100
METRIC RATING
25th/ 347
METRIC RANK
8.0%
NO VEHICLES IN HOUSEHOLD
99.9/ 100
METRIC RATING
49th/ 347
METRIC RANK
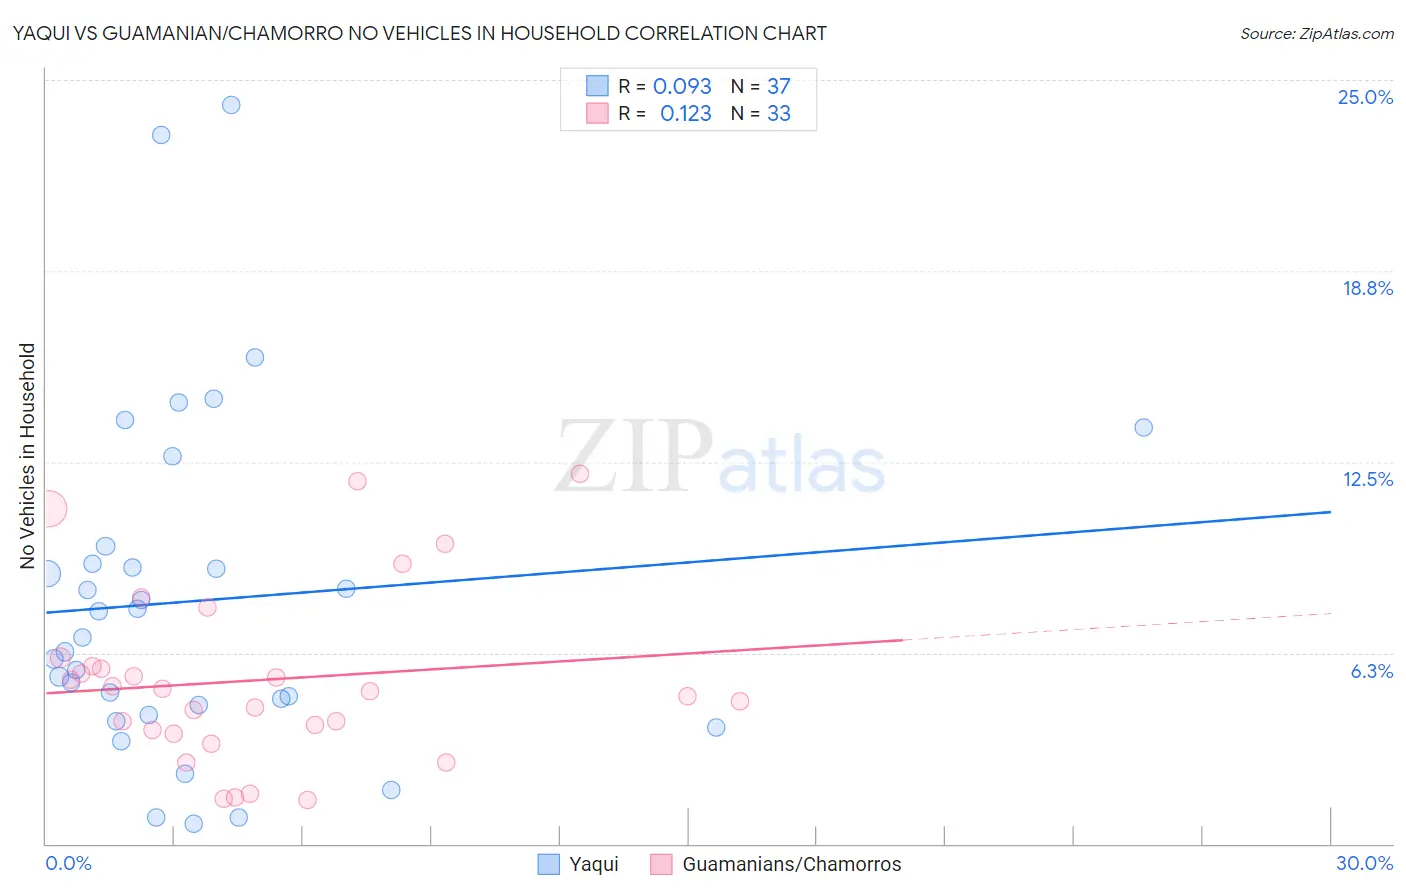
Yaqui vs Guamanian/Chamorro No Vehicles in Household Correlation Chart
The statistical analysis conducted on geographies consisting of 107,632,909 people shows a slight positive correlation between the proportion of Yaqui and percentage of households with no vehicle available in the United States with a correlation coefficient (R) of 0.093 and weighted average of 7.5%. Similarly, the statistical analysis conducted on geographies consisting of 221,696,459 people shows a poor positive correlation between the proportion of Guamanians/Chamorros and percentage of households with no vehicle available in the United States with a correlation coefficient (R) of 0.123 and weighted average of 8.0%, a difference of 6.7%.
No Vehicles in Household Correlation Summary
| Measurement | Yaqui | Guamanian/Chamorro |
| Minimum | 0.65% | 1.4% |
| Maximum | 24.2% | 12.1% |
| Range | 23.5% | 10.7% |
| Mean | 8.0% | 5.4% |
| Median | 6.8% | 5.0% |
| Interquartile 25% (IQ1) | 4.4% | 3.7% |
| Interquartile 75% (IQ3) | 9.4% | 6.0% |
| Interquartile Range (IQR) | 5.1% | 2.3% |
| Standard Deviation (Sample) | 5.5% | 2.9% |
| Standard Deviation (Population) | 5.5% | 2.8% |
Similar Demographics by No Vehicles in Household
Demographics Similar to Yaqui by No Vehicles in Household
In terms of no vehicles in household, the demographic groups most similar to Yaqui are Immigrants from Iraq (7.5%, a difference of 0.16%), French (7.4%, a difference of 0.56%), Irish (7.4%, a difference of 0.61%), Nepalese (7.4%, a difference of 1.2%), and Ottawa (7.4%, a difference of 1.4%).
| Demographics | Rating | Rank | No Vehicles in Household |
| Tongans | 100.0 /100 | #18 | Exceptional 7.2% |
| Arapaho | 100.0 /100 | #19 | Exceptional 7.4% |
| Ottawa | 100.0 /100 | #20 | Exceptional 7.4% |
| Nepalese | 100.0 /100 | #21 | Exceptional 7.4% |
| Irish | 100.0 /100 | #22 | Exceptional 7.4% |
| French | 100.0 /100 | #23 | Exceptional 7.4% |
| Immigrants | Iraq | 100.0 /100 | #24 | Exceptional 7.5% |
| Yaqui | 100.0 /100 | #25 | Exceptional 7.5% |
| Sri Lankans | 100.0 /100 | #26 | Exceptional 7.6% |
| British | 100.0 /100 | #27 | Exceptional 7.6% |
| Samoans | 100.0 /100 | #28 | Exceptional 7.6% |
| Americans | 100.0 /100 | #29 | Exceptional 7.7% |
| Finns | 100.0 /100 | #30 | Exceptional 7.7% |
| Native Hawaiians | 100.0 /100 | #31 | Exceptional 7.7% |
| Malaysians | 100.0 /100 | #32 | Exceptional 7.7% |
Demographics Similar to Guamanians/Chamorros by No Vehicles in Household
In terms of no vehicles in household, the demographic groups most similar to Guamanians/Chamorros are Belgian (8.0%, a difference of 0.070%), Afghan (8.0%, a difference of 0.17%), Korean (8.0%, a difference of 0.17%), Northern European (7.9%, a difference of 0.65%), and Hawaiian (8.0%, a difference of 0.75%).
| Demographics | Rating | Rank | No Vehicles in Household |
| Swiss | 99.9 /100 | #42 | Exceptional 7.9% |
| Chickasaw | 99.9 /100 | #43 | Exceptional 7.9% |
| Choctaw | 99.9 /100 | #44 | Exceptional 7.9% |
| Immigrants | Nonimmigrants | 99.9 /100 | #45 | Exceptional 7.9% |
| Spanish | 99.9 /100 | #46 | Exceptional 7.9% |
| Northern Europeans | 99.9 /100 | #47 | Exceptional 7.9% |
| Afghans | 99.9 /100 | #48 | Exceptional 8.0% |
| Guamanians/Chamorros | 99.9 /100 | #49 | Exceptional 8.0% |
| Belgians | 99.9 /100 | #50 | Exceptional 8.0% |
| Koreans | 99.9 /100 | #51 | Exceptional 8.0% |
| Hawaiians | 99.9 /100 | #52 | Exceptional 8.0% |
| Slovenes | 99.9 /100 | #53 | Exceptional 8.0% |
| Immigrants | Venezuela | 99.9 /100 | #54 | Exceptional 8.1% |
| Celtics | 99.9 /100 | #55 | Exceptional 8.1% |
| Immigrants | Afghanistan | 99.9 /100 | #56 | Exceptional 8.1% |