Immigrants from Senegal vs Immigrants from Saudi Arabia 2 or more Vehicles in Household
COMPARE
Immigrants from Senegal
Immigrants from Saudi Arabia
2 or more Vehicles in Household
2 or more Vehicles in Household Comparison
Immigrants from Senegal
Immigrants from Saudi Arabia
43.0%
2 OR MORE VEHICLES IN HOUSEHOLD
0.0/ 100
METRIC RATING
326th/ 347
METRIC RANK
54.2%
2 OR MORE VEHICLES IN HOUSEHOLD
11.3/ 100
METRIC RATING
210th/ 347
METRIC RANK
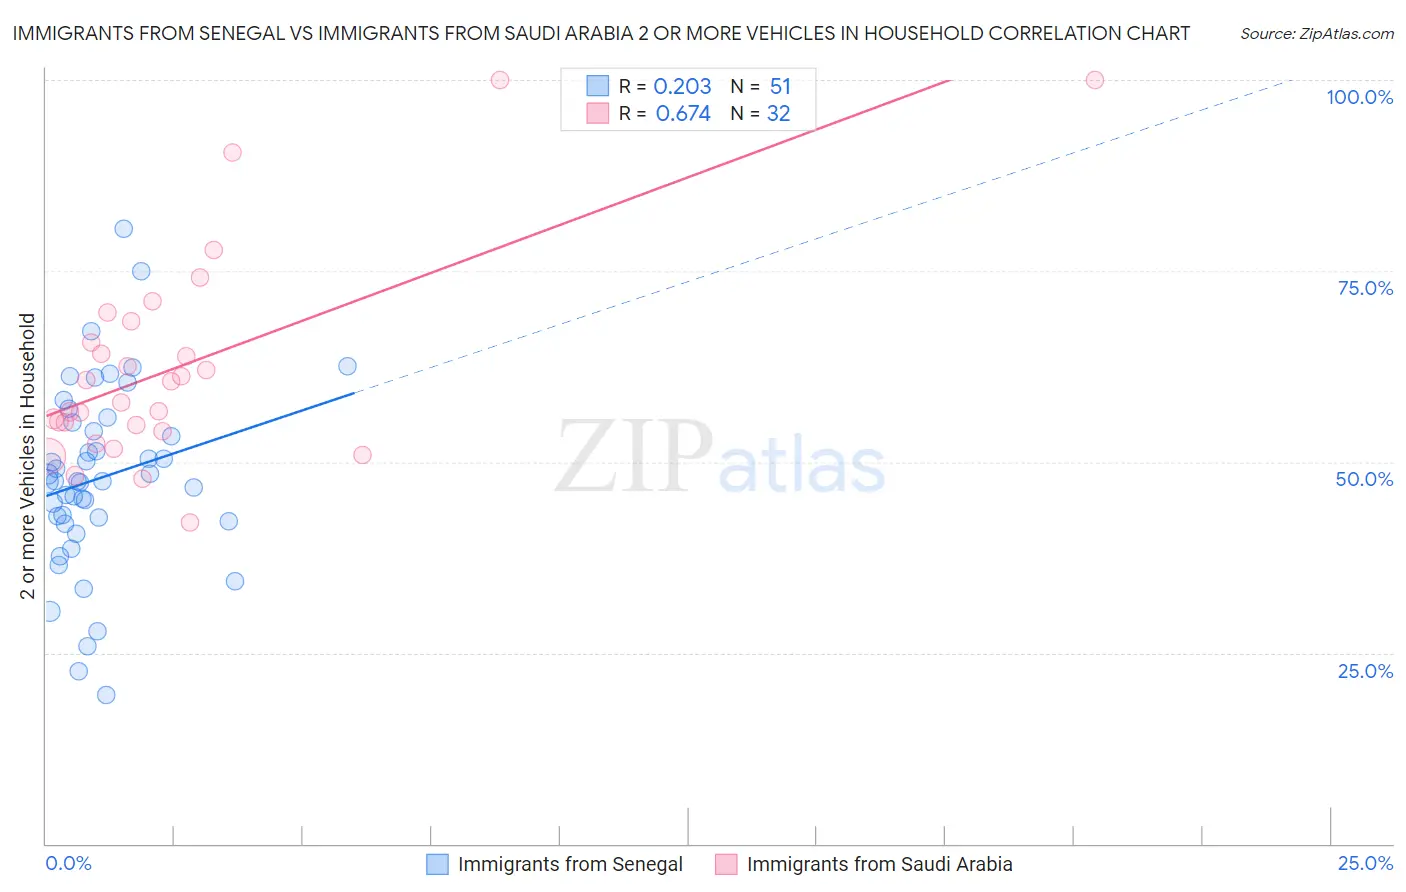
Immigrants from Senegal vs Immigrants from Saudi Arabia 2 or more Vehicles in Household Correlation Chart
The statistical analysis conducted on geographies consisting of 90,124,695 people shows a weak positive correlation between the proportion of Immigrants from Senegal and percentage of households with 2 or more vehicles available in the United States with a correlation coefficient (R) of 0.203 and weighted average of 43.0%. Similarly, the statistical analysis conducted on geographies consisting of 164,214,084 people shows a significant positive correlation between the proportion of Immigrants from Saudi Arabia and percentage of households with 2 or more vehicles available in the United States with a correlation coefficient (R) of 0.674 and weighted average of 54.2%, a difference of 26.0%.
2 or more Vehicles in Household Correlation Summary
| Measurement | Immigrants from Senegal | Immigrants from Saudi Arabia |
| Minimum | 19.5% | 42.1% |
| Maximum | 80.4% | 100.0% |
| Range | 61.0% | 57.9% |
| Mean | 47.9% | 62.5% |
| Median | 47.5% | 59.2% |
| Interquartile 25% (IQ1) | 42.3% | 54.4% |
| Interquartile 75% (IQ3) | 55.2% | 67.0% |
| Interquartile Range (IQR) | 12.9% | 12.6% |
| Standard Deviation (Sample) | 12.1% | 13.8% |
| Standard Deviation (Population) | 12.0% | 13.6% |
Similar Demographics by 2 or more Vehicles in Household
Demographics Similar to Immigrants from Senegal by 2 or more Vehicles in Household
In terms of 2 or more vehicles in household, the demographic groups most similar to Immigrants from Senegal are Immigrants from West Indies (43.1%, a difference of 0.15%), Immigrants from Yemen (42.8%, a difference of 0.41%), Immigrants from Cabo Verde (43.3%, a difference of 0.72%), Inupiat (42.6%, a difference of 0.91%), and Ecuadorian (42.0%, a difference of 2.5%).
| Demographics | Rating | Rank | 2 or more Vehicles in Household |
| Jamaicans | 0.0 /100 | #319 | Tragic 45.8% |
| Soviet Union | 0.0 /100 | #320 | Tragic 45.7% |
| Immigrants | Jamaica | 0.0 /100 | #321 | Tragic 44.5% |
| Senegalese | 0.0 /100 | #322 | Tragic 44.2% |
| Immigrants | Caribbean | 0.0 /100 | #323 | Tragic 44.2% |
| Immigrants | Cabo Verde | 0.0 /100 | #324 | Tragic 43.3% |
| Immigrants | West Indies | 0.0 /100 | #325 | Tragic 43.1% |
| Immigrants | Senegal | 0.0 /100 | #326 | Tragic 43.0% |
| Immigrants | Yemen | 0.0 /100 | #327 | Tragic 42.8% |
| Inupiat | 0.0 /100 | #328 | Tragic 42.6% |
| Ecuadorians | 0.0 /100 | #329 | Tragic 42.0% |
| Immigrants | Dominica | 0.0 /100 | #330 | Tragic 41.6% |
| West Indians | 0.0 /100 | #331 | Tragic 41.3% |
| Trinidadians and Tobagonians | 0.0 /100 | #332 | Tragic 40.9% |
| Immigrants | Ecuador | 0.0 /100 | #333 | Tragic 40.5% |
Demographics Similar to Immigrants from Saudi Arabia by 2 or more Vehicles in Household
In terms of 2 or more vehicles in household, the demographic groups most similar to Immigrants from Saudi Arabia are Immigrants from Hungary (54.2%, a difference of 0.010%), Immigrants from Chile (54.2%, a difference of 0.030%), Egyptian (54.3%, a difference of 0.060%), Immigrants from Bulgaria (54.3%, a difference of 0.060%), and Turkish (54.3%, a difference of 0.15%).
| Demographics | Rating | Rank | 2 or more Vehicles in Household |
| Immigrants | Peru | 14.3 /100 | #203 | Poor 54.4% |
| Immigrants | Belgium | 13.7 /100 | #204 | Poor 54.3% |
| Cheyenne | 13.6 /100 | #205 | Poor 54.3% |
| Immigrants | Latin America | 13.1 /100 | #206 | Poor 54.3% |
| Turks | 13.0 /100 | #207 | Poor 54.3% |
| Egyptians | 12.0 /100 | #208 | Poor 54.3% |
| Immigrants | Bulgaria | 12.0 /100 | #209 | Poor 54.3% |
| Immigrants | Saudi Arabia | 11.3 /100 | #210 | Poor 54.2% |
| Immigrants | Hungary | 11.3 /100 | #211 | Poor 54.2% |
| Immigrants | Chile | 11.1 /100 | #212 | Poor 54.2% |
| Guatemalans | 9.6 /100 | #213 | Tragic 54.1% |
| Immigrants | Czechoslovakia | 9.4 /100 | #214 | Tragic 54.1% |
| Aleuts | 9.3 /100 | #215 | Tragic 54.1% |
| Immigrants | Western Asia | 9.3 /100 | #216 | Tragic 54.1% |
| Immigrants | Burma/Myanmar | 7.1 /100 | #217 | Tragic 53.9% |