Immigrants from Portugal vs Pakistani No Vehicles in Household
COMPARE
Immigrants from Portugal
Pakistani
No Vehicles in Household
No Vehicles in Household Comparison
Immigrants from Portugal
Pakistanis
11.7%
NO VEHICLES IN HOUSEHOLD
2.2/ 100
METRIC RATING
244th/ 347
METRIC RANK
9.0%
NO VEHICLES IN HOUSEHOLD
98.3/ 100
METRIC RATING
101st/ 347
METRIC RANK
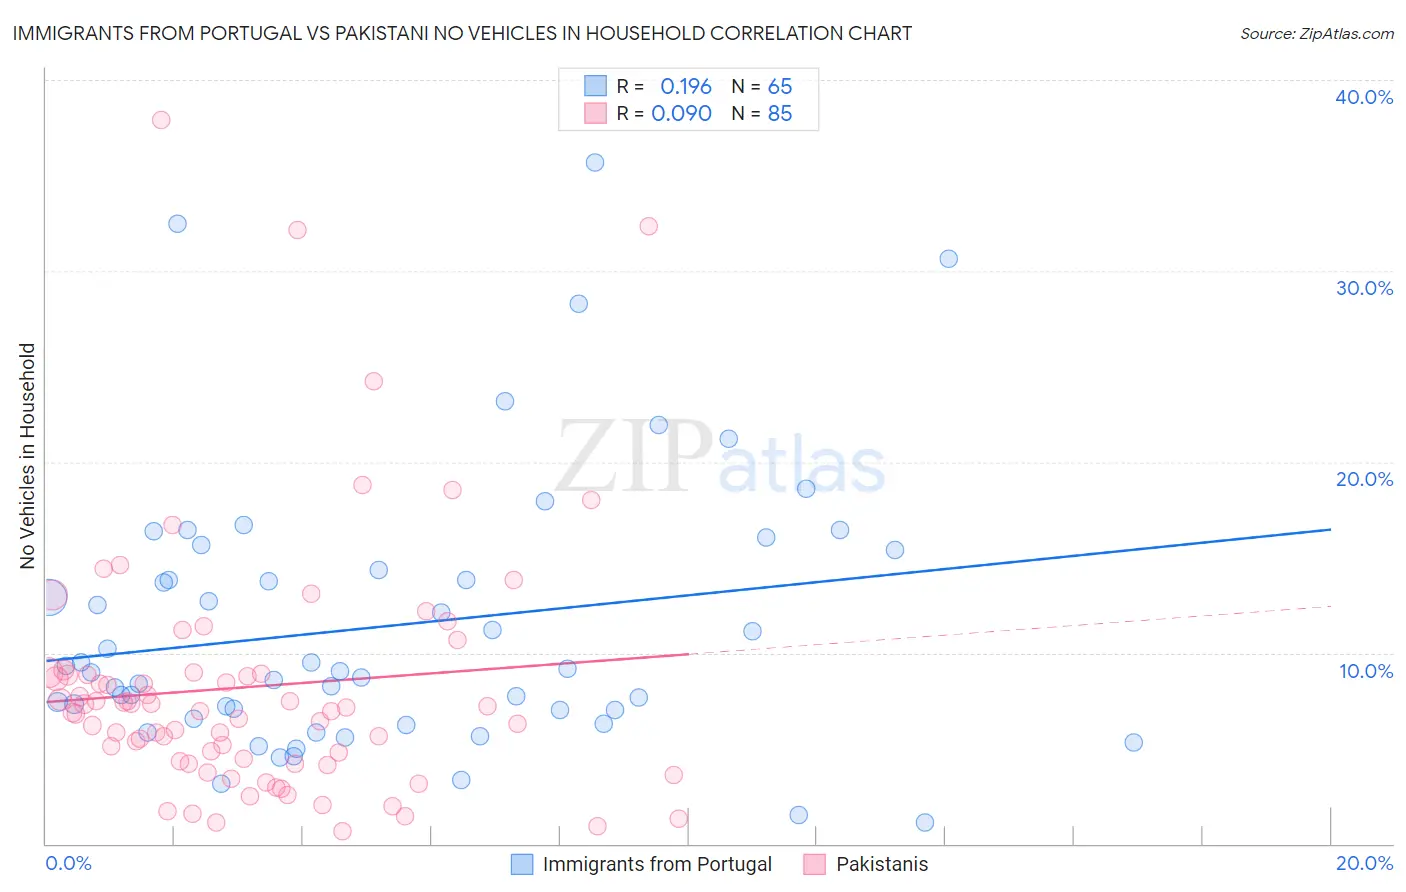
Immigrants from Portugal vs Pakistani No Vehicles in Household Correlation Chart
The statistical analysis conducted on geographies consisting of 174,581,030 people shows a poor positive correlation between the proportion of Immigrants from Portugal and percentage of households with no vehicle available in the United States with a correlation coefficient (R) of 0.196 and weighted average of 11.7%. Similarly, the statistical analysis conducted on geographies consisting of 334,782,666 people shows a slight positive correlation between the proportion of Pakistanis and percentage of households with no vehicle available in the United States with a correlation coefficient (R) of 0.090 and weighted average of 9.0%, a difference of 30.7%.
No Vehicles in Household Correlation Summary
| Measurement | Immigrants from Portugal | Pakistani |
| Minimum | 1.1% | 0.66% |
| Maximum | 35.7% | 37.9% |
| Range | 34.6% | 37.2% |
| Mean | 11.4% | 8.2% |
| Median | 9.0% | 6.9% |
| Interquartile 25% (IQ1) | 6.8% | 4.3% |
| Interquartile 75% (IQ3) | 14.9% | 8.9% |
| Interquartile Range (IQR) | 8.1% | 4.7% |
| Standard Deviation (Sample) | 7.2% | 6.7% |
| Standard Deviation (Population) | 7.1% | 6.6% |
Similar Demographics by No Vehicles in Household
Demographics Similar to Immigrants from Portugal by No Vehicles in Household
In terms of no vehicles in household, the demographic groups most similar to Immigrants from Portugal are Cheyenne (11.7%, a difference of 0.18%), Immigrants from Honduras (11.8%, a difference of 0.19%), Menominee (11.8%, a difference of 0.36%), Immigrants from Czechoslovakia (11.8%, a difference of 0.41%), and Immigrants from Belgium (11.8%, a difference of 0.42%).
| Demographics | Rating | Rank | No Vehicles in Household |
| Ute | 3.3 /100 | #237 | Tragic 11.6% |
| Russians | 3.2 /100 | #238 | Tragic 11.6% |
| Taiwanese | 2.8 /100 | #239 | Tragic 11.7% |
| Immigrants | Immigrants | 2.7 /100 | #240 | Tragic 11.7% |
| Eastern Europeans | 2.7 /100 | #241 | Tragic 11.7% |
| Turks | 2.6 /100 | #242 | Tragic 11.7% |
| Cheyenne | 2.4 /100 | #243 | Tragic 11.7% |
| Immigrants | Portugal | 2.2 /100 | #244 | Tragic 11.7% |
| Immigrants | Honduras | 2.1 /100 | #245 | Tragic 11.8% |
| Menominee | 2.0 /100 | #246 | Tragic 11.8% |
| Immigrants | Czechoslovakia | 2.0 /100 | #247 | Tragic 11.8% |
| Immigrants | Belgium | 1.9 /100 | #248 | Tragic 11.8% |
| Immigrants | Nigeria | 1.9 /100 | #249 | Tragic 11.8% |
| Paiute | 1.8 /100 | #250 | Tragic 11.8% |
| Blacks/African Americans | 1.6 /100 | #251 | Tragic 11.9% |
Demographics Similar to Pakistanis by No Vehicles in Household
In terms of no vehicles in household, the demographic groups most similar to Pakistanis are Asian (9.0%, a difference of 0.040%), Yugoslavian (9.0%, a difference of 0.050%), Seminole (9.0%, a difference of 0.050%), Bulgarian (9.0%, a difference of 0.22%), and Slavic (9.0%, a difference of 0.28%).
| Demographics | Rating | Rank | No Vehicles in Household |
| Austrians | 98.9 /100 | #94 | Exceptional 8.8% |
| Potawatomi | 98.8 /100 | #95 | Exceptional 8.8% |
| Immigrants | Bolivia | 98.7 /100 | #96 | Exceptional 8.9% |
| Immigrants | Central America | 98.5 /100 | #97 | Exceptional 8.9% |
| Slavs | 98.4 /100 | #98 | Exceptional 9.0% |
| Bulgarians | 98.4 /100 | #99 | Exceptional 9.0% |
| Asians | 98.3 /100 | #100 | Exceptional 9.0% |
| Pakistanis | 98.3 /100 | #101 | Exceptional 9.0% |
| Yugoslavians | 98.3 /100 | #102 | Exceptional 9.0% |
| Seminole | 98.3 /100 | #103 | Exceptional 9.0% |
| Zimbabweans | 98.0 /100 | #104 | Exceptional 9.0% |
| Spanish Americans | 97.9 /100 | #105 | Exceptional 9.1% |
| Laotians | 97.8 /100 | #106 | Exceptional 9.1% |
| Hispanics or Latinos | 97.7 /100 | #107 | Exceptional 9.1% |
| Mexican American Indians | 97.6 /100 | #108 | Exceptional 9.1% |