Immigrants from Portugal vs Ecuadorian Median Female Earnings
COMPARE
Immigrants from Portugal
Ecuadorian
Median Female Earnings
Median Female Earnings Comparison
Immigrants from Portugal
Ecuadorians
$39,788
MEDIAN FEMALE EARNINGS
54.7/ 100
METRIC RATING
171st/ 347
METRIC RANK
$39,117
MEDIAN FEMALE EARNINGS
23.0/ 100
METRIC RATING
198th/ 347
METRIC RANK
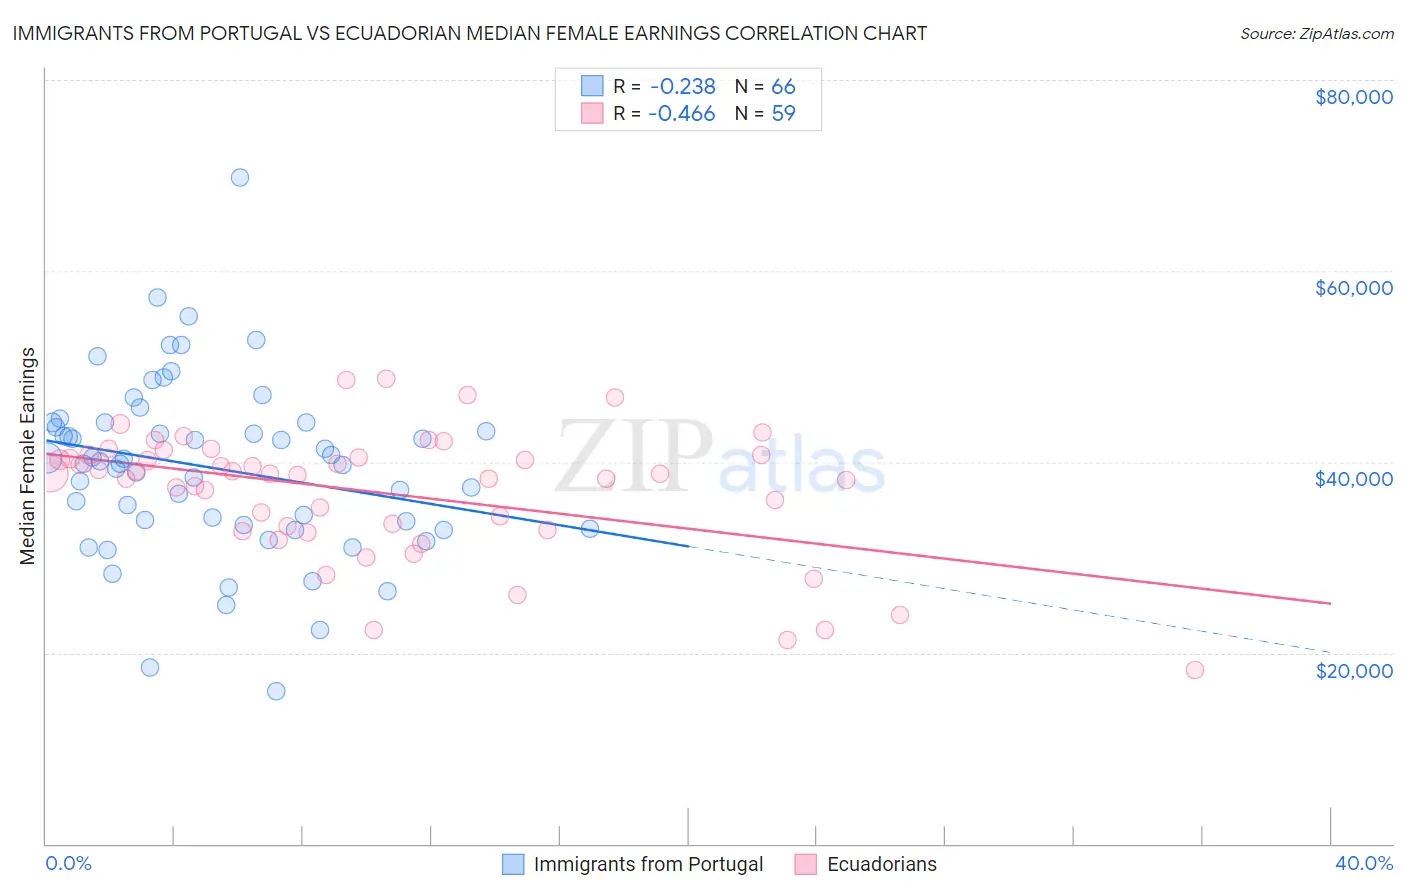
Immigrants from Portugal vs Ecuadorian Median Female Earnings Correlation Chart
The statistical analysis conducted on geographies consisting of 174,753,972 people shows a weak negative correlation between the proportion of Immigrants from Portugal and median female earnings in the United States with a correlation coefficient (R) of -0.238 and weighted average of $39,788. Similarly, the statistical analysis conducted on geographies consisting of 317,768,911 people shows a moderate negative correlation between the proportion of Ecuadorians and median female earnings in the United States with a correlation coefficient (R) of -0.466 and weighted average of $39,117, a difference of 1.7%.
Median Female Earnings Correlation Summary
| Measurement | Immigrants from Portugal | Ecuadorian |
| Minimum | $15,996 | $18,150 |
| Maximum | $69,732 | $48,689 |
| Range | $53,736 | $30,539 |
| Mean | $39,346 | $36,751 |
| Median | $39,980 | $38,737 |
| Interquartile 25% (IQ1) | $33,451 | $32,822 |
| Interquartile 75% (IQ3) | $44,115 | $40,668 |
| Interquartile Range (IQR) | $10,664 | $7,846 |
| Standard Deviation (Sample) | $9,199 | $6,680 |
| Standard Deviation (Population) | $9,130 | $6,623 |
Similar Demographics by Median Female Earnings
Demographics Similar to Immigrants from Portugal by Median Female Earnings
In terms of median female earnings, the demographic groups most similar to Immigrants from Portugal are British ($39,772, a difference of 0.040%), Slovene ($39,817, a difference of 0.070%), Canadian ($39,724, a difference of 0.16%), Kenyan ($39,860, a difference of 0.18%), and Immigrants from Peru ($39,871, a difference of 0.21%).
| Demographics | Rating | Rank | Median Female Earnings |
| Immigrants | Saudi Arabia | 62.9 /100 | #164 | Good $39,952 |
| Immigrants | Bangladesh | 60.8 /100 | #165 | Good $39,910 |
| Immigrants | Ghana | 60.0 /100 | #166 | Good $39,894 |
| Luxembourgers | 59.9 /100 | #167 | Average $39,891 |
| Immigrants | Peru | 58.9 /100 | #168 | Average $39,871 |
| Kenyans | 58.4 /100 | #169 | Average $39,860 |
| Slovenes | 56.2 /100 | #170 | Average $39,817 |
| Immigrants | Portugal | 54.7 /100 | #171 | Average $39,788 |
| British | 53.8 /100 | #172 | Average $39,772 |
| Canadians | 51.4 /100 | #173 | Average $39,724 |
| South Americans | 50.0 /100 | #174 | Average $39,698 |
| Immigrants | South America | 47.2 /100 | #175 | Average $39,643 |
| Nigerians | 47.0 /100 | #176 | Average $39,641 |
| Costa Ricans | 46.1 /100 | #177 | Average $39,622 |
| Slavs | 45.6 /100 | #178 | Average $39,613 |
Demographics Similar to Ecuadorians by Median Female Earnings
In terms of median female earnings, the demographic groups most similar to Ecuadorians are Icelander ($39,109, a difference of 0.020%), Assyrian/Chaldean/Syriac ($39,159, a difference of 0.11%), Immigrants from Panama ($39,049, a difference of 0.17%), Panamanian ($39,049, a difference of 0.17%), and Immigrants from Costa Rica ($39,186, a difference of 0.18%).
| Demographics | Rating | Rank | Median Female Earnings |
| Immigrants | Western Africa | 32.7 /100 | #191 | Fair $39,351 |
| Immigrants | Immigrants | 31.7 /100 | #192 | Fair $39,328 |
| Immigrants | Nigeria | 30.2 /100 | #193 | Fair $39,294 |
| Irish | 30.0 /100 | #194 | Fair $39,291 |
| Uruguayans | 27.3 /100 | #195 | Fair $39,228 |
| Immigrants | Costa Rica | 25.6 /100 | #196 | Fair $39,186 |
| Assyrians/Chaldeans/Syriacs | 24.6 /100 | #197 | Fair $39,159 |
| Ecuadorians | 23.0 /100 | #198 | Fair $39,117 |
| Icelanders | 22.7 /100 | #199 | Fair $39,109 |
| Immigrants | Panama | 20.6 /100 | #200 | Fair $39,049 |
| Panamanians | 20.6 /100 | #201 | Fair $39,049 |
| Slovaks | 19.9 /100 | #202 | Poor $39,029 |
| Czechs | 18.7 /100 | #203 | Poor $38,992 |
| Immigrants | Uruguay | 17.3 /100 | #204 | Poor $38,945 |
| Immigrants | Colombia | 16.3 /100 | #205 | Poor $38,913 |