Immigrants from Oceania vs Serbian No Vehicles in Household
COMPARE
Immigrants from Oceania
Serbian
No Vehicles in Household
No Vehicles in Household Comparison
Immigrants from Oceania
Serbians
9.7%
NO VEHICLES IN HOUSEHOLD
87.1/ 100
METRIC RATING
133rd/ 347
METRIC RANK
9.4%
NO VEHICLES IN HOUSEHOLD
94.3/ 100
METRIC RATING
114th/ 347
METRIC RANK
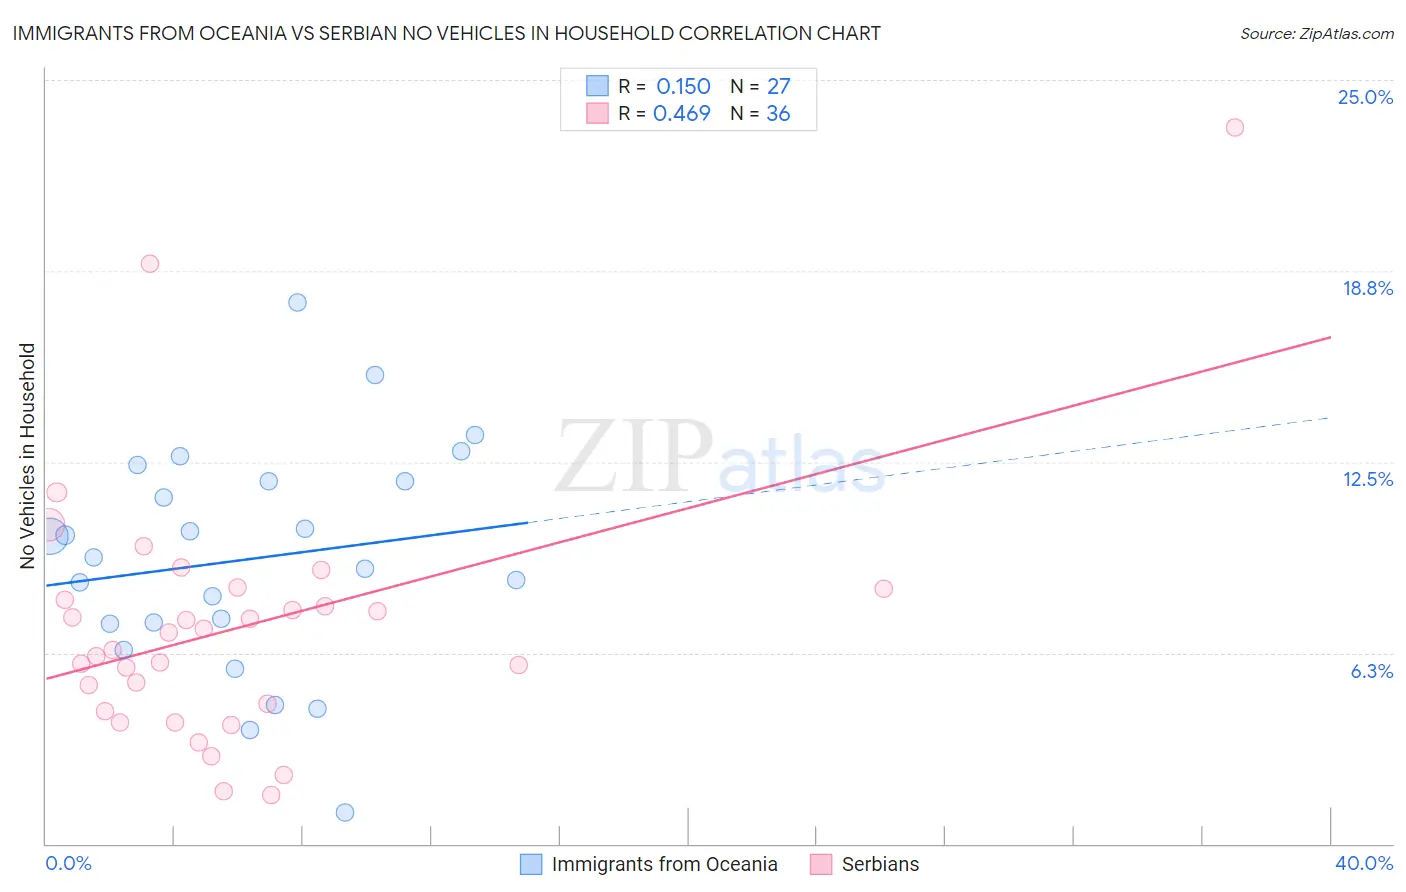
Immigrants from Oceania vs Serbian No Vehicles in Household Correlation Chart
The statistical analysis conducted on geographies consisting of 304,786,769 people shows a poor positive correlation between the proportion of Immigrants from Oceania and percentage of households with no vehicle available in the United States with a correlation coefficient (R) of 0.150 and weighted average of 9.7%. Similarly, the statistical analysis conducted on geographies consisting of 267,180,680 people shows a moderate positive correlation between the proportion of Serbians and percentage of households with no vehicle available in the United States with a correlation coefficient (R) of 0.469 and weighted average of 9.4%, a difference of 3.3%.
No Vehicles in Household Correlation Summary
| Measurement | Immigrants from Oceania | Serbian |
| Minimum | 1.0% | 1.6% |
| Maximum | 17.7% | 23.5% |
| Range | 16.7% | 21.9% |
| Mean | 9.3% | 7.1% |
| Median | 9.4% | 6.6% |
| Interquartile 25% (IQ1) | 7.2% | 4.5% |
| Interquartile 75% (IQ3) | 11.9% | 8.2% |
| Interquartile Range (IQR) | 4.7% | 3.7% |
| Standard Deviation (Sample) | 3.7% | 4.2% |
| Standard Deviation (Population) | 3.6% | 4.2% |
Demographics Similar to Immigrants from Oceania and Serbians by No Vehicles in Household
In terms of no vehicles in household, the demographic groups most similar to Immigrants from Oceania are Kenyan (9.7%, a difference of 0.30%), Immigrants from the Azores (9.7%, a difference of 0.37%), Burmese (9.7%, a difference of 0.58%), Nicaraguan (9.7%, a difference of 0.83%), and Immigrants from Syria (9.6%, a difference of 0.86%). Similarly, the demographic groups most similar to Serbians are Navajo (9.4%, a difference of 0.070%), Japanese (9.4%, a difference of 0.13%), Chippewa (9.4%, a difference of 0.30%), Immigrants from Netherlands (9.4%, a difference of 0.43%), and Greek (9.5%, a difference of 0.86%).
| Demographics | Rating | Rank | No Vehicles in Household |
| Immigrants | Netherlands | 94.8 /100 | #113 | Exceptional 9.4% |
| Serbians | 94.3 /100 | #114 | Exceptional 9.4% |
| Navajo | 94.2 /100 | #115 | Exceptional 9.4% |
| Japanese | 94.1 /100 | #116 | Exceptional 9.4% |
| Chippewa | 93.8 /100 | #117 | Exceptional 9.4% |
| Greeks | 92.9 /100 | #118 | Exceptional 9.5% |
| Fijians | 92.7 /100 | #119 | Exceptional 9.5% |
| Immigrants | Thailand | 92.6 /100 | #120 | Exceptional 9.5% |
| Puget Sound Salish | 92.4 /100 | #121 | Exceptional 9.5% |
| Costa Ricans | 92.3 /100 | #122 | Exceptional 9.5% |
| Blackfeet | 91.4 /100 | #123 | Exceptional 9.6% |
| Immigrants | Korea | 90.9 /100 | #124 | Exceptional 9.6% |
| Immigrants | Cameroon | 90.6 /100 | #125 | Exceptional 9.6% |
| Icelanders | 90.2 /100 | #126 | Exceptional 9.6% |
| Immigrants | Kenya | 89.7 /100 | #127 | Excellent 9.6% |
| Immigrants | Syria | 89.5 /100 | #128 | Excellent 9.6% |
| Nicaraguans | 89.5 /100 | #129 | Excellent 9.7% |
| Burmese | 88.8 /100 | #130 | Excellent 9.7% |
| Immigrants | Azores | 88.2 /100 | #131 | Excellent 9.7% |
| Kenyans | 88.0 /100 | #132 | Excellent 9.7% |
| Immigrants | Oceania | 87.1 /100 | #133 | Excellent 9.7% |