Immigrants from Northern Europe vs Immigrants from Western Asia No Vehicles in Household
COMPARE
Immigrants from Northern Europe
Immigrants from Western Asia
No Vehicles in Household
No Vehicles in Household Comparison
Immigrants from Northern Europe
Immigrants from Western Asia
10.7%
NO VEHICLES IN HOUSEHOLD
33.1/ 100
METRIC RATING
191st/ 347
METRIC RANK
11.0%
NO VEHICLES IN HOUSEHOLD
13.9/ 100
METRIC RATING
212th/ 347
METRIC RANK
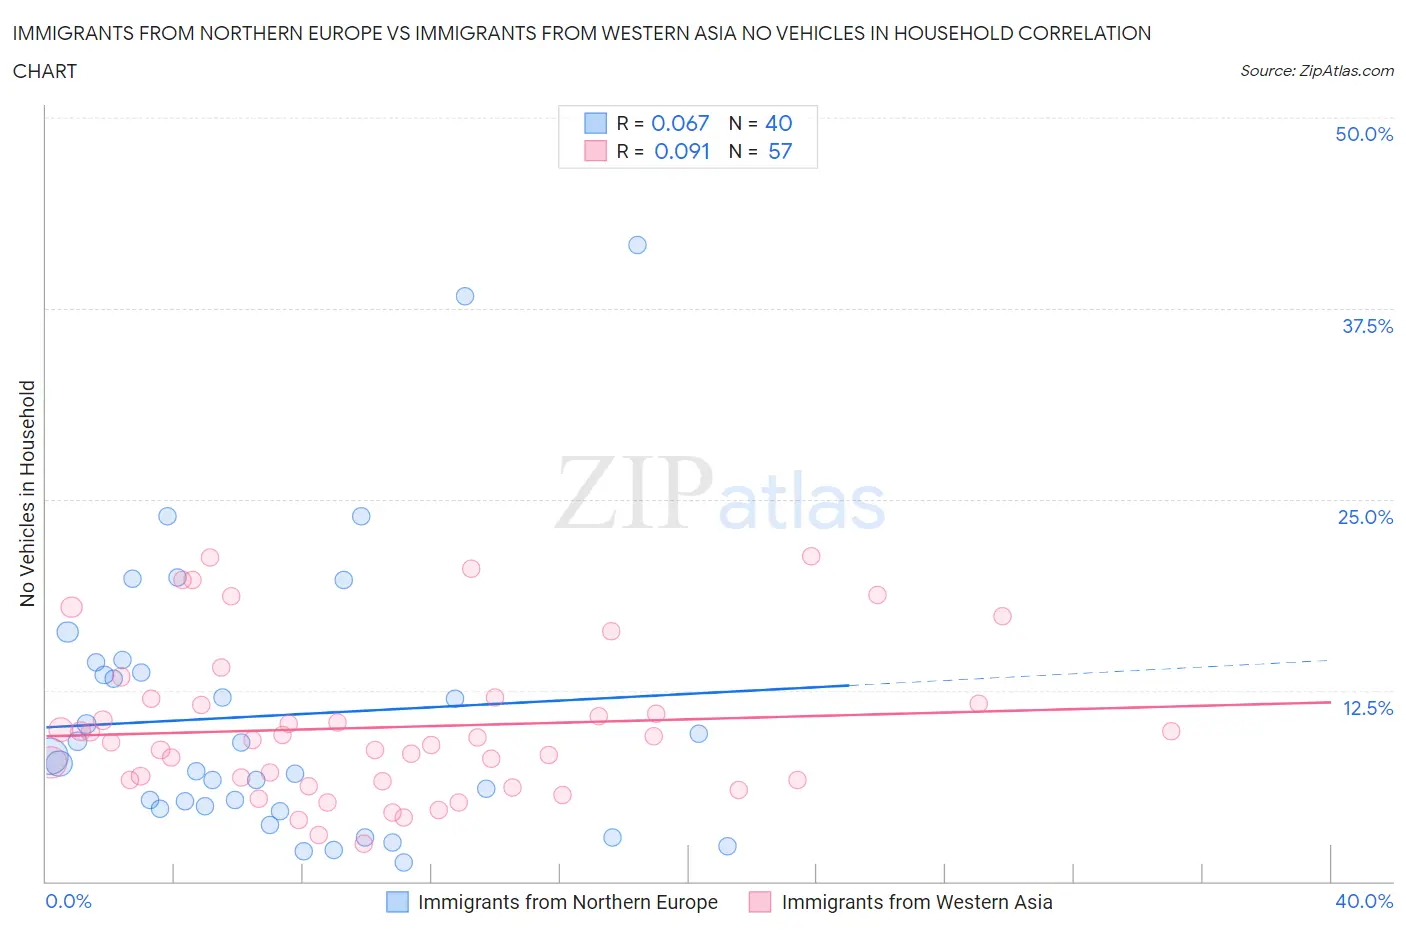
Immigrants from Northern Europe vs Immigrants from Western Asia No Vehicles in Household Correlation Chart
The statistical analysis conducted on geographies consisting of 475,076,775 people shows a slight positive correlation between the proportion of Immigrants from Northern Europe and percentage of households with no vehicle available in the United States with a correlation coefficient (R) of 0.067 and weighted average of 10.7%. Similarly, the statistical analysis conducted on geographies consisting of 403,545,957 people shows a slight positive correlation between the proportion of Immigrants from Western Asia and percentage of households with no vehicle available in the United States with a correlation coefficient (R) of 0.091 and weighted average of 11.0%, a difference of 3.7%.
No Vehicles in Household Correlation Summary
| Measurement | Immigrants from Northern Europe | Immigrants from Western Asia |
| Minimum | 1.2% | 2.5% |
| Maximum | 41.7% | 21.2% |
| Range | 40.4% | 18.8% |
| Mean | 10.8% | 10.1% |
| Median | 7.9% | 9.3% |
| Interquartile 25% (IQ1) | 4.8% | 6.6% |
| Interquartile 75% (IQ3) | 14.0% | 11.8% |
| Interquartile Range (IQR) | 9.2% | 5.2% |
| Standard Deviation (Sample) | 9.1% | 4.9% |
| Standard Deviation (Population) | 9.0% | 4.9% |
Similar Demographics by No Vehicles in Household
Demographics Similar to Immigrants from Northern Europe by No Vehicles in Household
In terms of no vehicles in household, the demographic groups most similar to Immigrants from Northern Europe are Carpatho Rusyn (10.7%, a difference of 0.14%), Immigrants from North Macedonia (10.6%, a difference of 0.23%), Immigrants from Eritrea (10.6%, a difference of 0.47%), Immigrants from Armenia (10.6%, a difference of 0.65%), and Immigrants from Poland (10.6%, a difference of 0.77%).
| Demographics | Rating | Rank | No Vehicles in Household |
| Immigrants | Nepal | 42.4 /100 | #184 | Average 10.5% |
| South Americans | 41.9 /100 | #185 | Average 10.5% |
| German Russians | 40.6 /100 | #186 | Average 10.5% |
| Immigrants | Poland | 38.4 /100 | #187 | Fair 10.6% |
| Immigrants | Armenia | 37.5 /100 | #188 | Fair 10.6% |
| Immigrants | Eritrea | 36.3 /100 | #189 | Fair 10.6% |
| Immigrants | North Macedonia | 34.6 /100 | #190 | Fair 10.6% |
| Immigrants | Northern Europe | 33.1 /100 | #191 | Fair 10.7% |
| Carpatho Rusyns | 32.1 /100 | #192 | Fair 10.7% |
| Ukrainians | 28.0 /100 | #193 | Fair 10.7% |
| Pueblo | 27.0 /100 | #194 | Fair 10.8% |
| Immigrants | Brazil | 26.3 /100 | #195 | Fair 10.8% |
| Central Americans | 24.3 /100 | #196 | Fair 10.8% |
| Shoshone | 24.1 /100 | #197 | Fair 10.8% |
| Immigrants | Sweden | 22.9 /100 | #198 | Fair 10.8% |
Demographics Similar to Immigrants from Western Asia by No Vehicles in Household
In terms of no vehicles in household, the demographic groups most similar to Immigrants from Western Asia are Crow (11.0%, a difference of 0.090%), Apache (11.0%, a difference of 0.25%), Pennsylvania German (11.0%, a difference of 0.41%), Immigrants from Hungary (11.1%, a difference of 0.43%), and Immigrants from Italy (11.0%, a difference of 0.45%).
| Demographics | Rating | Rank | No Vehicles in Household |
| Immigrants | Chile | 15.9 /100 | #205 | Poor 11.0% |
| Somalis | 15.9 /100 | #206 | Poor 11.0% |
| Sierra Leoneans | 15.7 /100 | #207 | Poor 11.0% |
| Immigrants | Italy | 15.6 /100 | #208 | Poor 11.0% |
| Pennsylvania Germans | 15.5 /100 | #209 | Poor 11.0% |
| Apache | 14.8 /100 | #210 | Poor 11.0% |
| Crow | 14.2 /100 | #211 | Poor 11.0% |
| Immigrants | Western Asia | 13.9 /100 | #212 | Poor 11.0% |
| Immigrants | Hungary | 12.3 /100 | #213 | Poor 11.1% |
| Immigrants | Denmark | 12.1 /100 | #214 | Poor 11.1% |
| Immigrants | Sri Lanka | 10.6 /100 | #215 | Poor 11.2% |
| Immigrants | Argentina | 10.6 /100 | #216 | Poor 11.2% |
| Dutch West Indians | 10.2 /100 | #217 | Poor 11.2% |
| Immigrants | Guatemala | 10.0 /100 | #218 | Tragic 11.2% |
| Argentineans | 9.6 /100 | #219 | Tragic 11.2% |