Immigrants from Northern Europe vs Filipino No Vehicles in Household
COMPARE
Immigrants from Northern Europe
Filipino
No Vehicles in Household
No Vehicles in Household Comparison
Immigrants from Northern Europe
Filipinos
10.7%
NO VEHICLES IN HOUSEHOLD
33.1/ 100
METRIC RATING
191st/ 347
METRIC RANK
10.4%
NO VEHICLES IN HOUSEHOLD
50.1/ 100
METRIC RATING
173rd/ 347
METRIC RANK
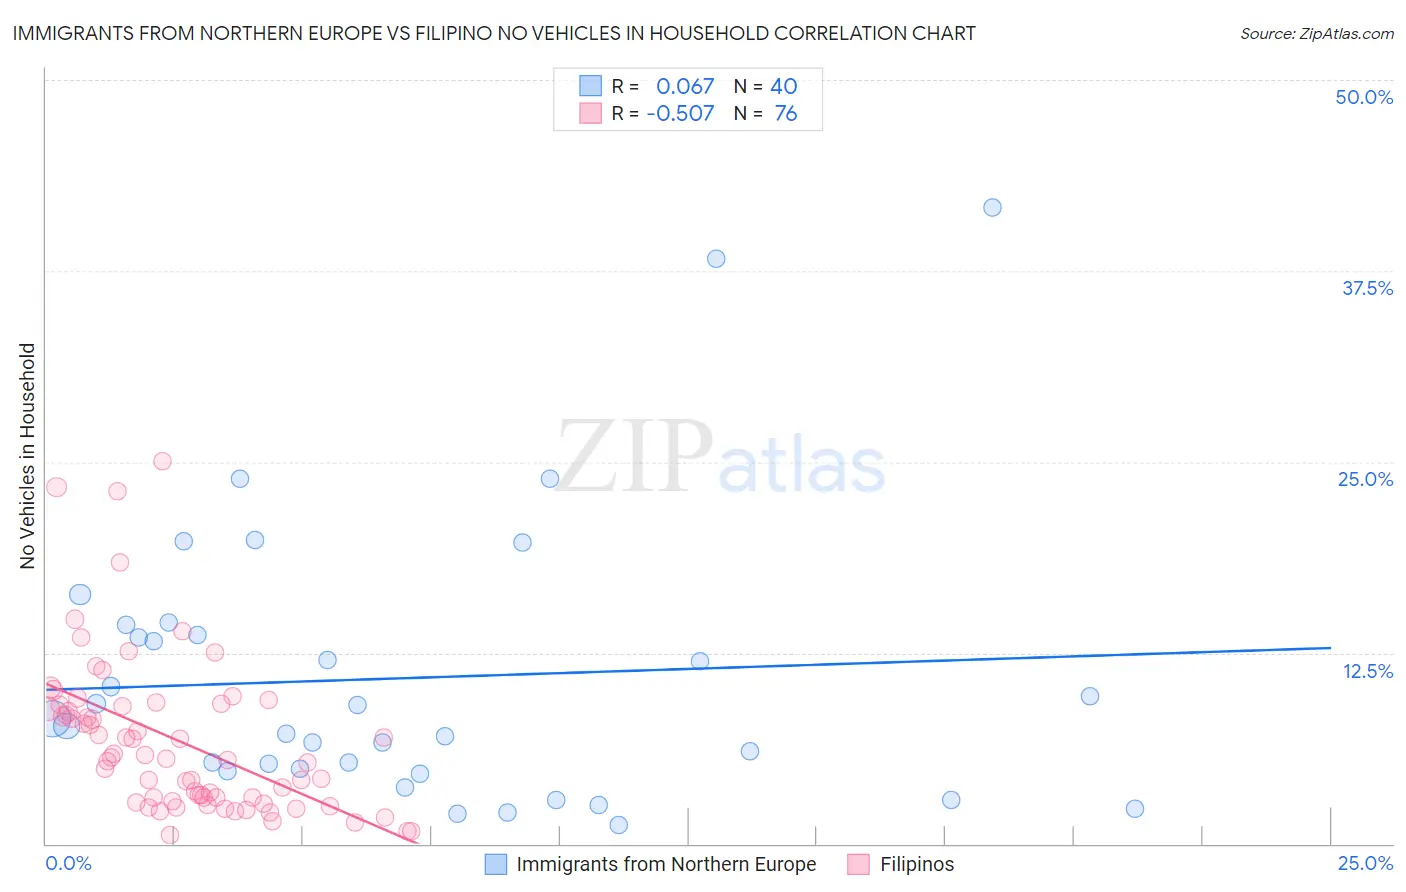
Immigrants from Northern Europe vs Filipino No Vehicles in Household Correlation Chart
The statistical analysis conducted on geographies consisting of 475,076,775 people shows a slight positive correlation between the proportion of Immigrants from Northern Europe and percentage of households with no vehicle available in the United States with a correlation coefficient (R) of 0.067 and weighted average of 10.7%. Similarly, the statistical analysis conducted on geographies consisting of 253,938,776 people shows a substantial negative correlation between the proportion of Filipinos and percentage of households with no vehicle available in the United States with a correlation coefficient (R) of -0.507 and weighted average of 10.4%, a difference of 2.4%.
No Vehicles in Household Correlation Summary
| Measurement | Immigrants from Northern Europe | Filipino |
| Minimum | 1.2% | 0.54% |
| Maximum | 41.7% | 25.0% |
| Range | 40.4% | 24.5% |
| Mean | 10.8% | 6.8% |
| Median | 7.9% | 5.6% |
| Interquartile 25% (IQ1) | 4.8% | 2.9% |
| Interquartile 75% (IQ3) | 14.0% | 9.0% |
| Interquartile Range (IQR) | 9.2% | 6.1% |
| Standard Deviation (Sample) | 9.1% | 5.1% |
| Standard Deviation (Population) | 9.0% | 5.1% |
Demographics Similar to Immigrants from Northern Europe and Filipinos by No Vehicles in Household
In terms of no vehicles in household, the demographic groups most similar to Immigrants from Northern Europe are Carpatho Rusyn (10.7%, a difference of 0.14%), Immigrants from North Macedonia (10.6%, a difference of 0.23%), Immigrants from Eritrea (10.6%, a difference of 0.47%), Immigrants from Armenia (10.6%, a difference of 0.65%), and Immigrants from Poland (10.6%, a difference of 0.77%). Similarly, the demographic groups most similar to Filipinos are Immigrants from Sudan (10.4%, a difference of 0.010%), Immigrants from Burma/Myanmar (10.4%, a difference of 0.13%), French American Indian (10.4%, a difference of 0.13%), Immigrants from El Salvador (10.4%, a difference of 0.14%), and Brazilian (10.4%, a difference of 0.22%).
| Demographics | Rating | Rank | No Vehicles in Household |
| Brazilians | 51.7 /100 | #172 | Average 10.4% |
| Filipinos | 50.1 /100 | #173 | Average 10.4% |
| Immigrants | Sudan | 50.0 /100 | #174 | Average 10.4% |
| Immigrants | Burma/Myanmar | 49.1 /100 | #175 | Average 10.4% |
| French American Indians | 49.1 /100 | #176 | Average 10.4% |
| Immigrants | El Salvador | 49.1 /100 | #177 | Average 10.4% |
| Immigrants | Ethiopia | 48.0 /100 | #178 | Average 10.4% |
| Ethiopians | 45.8 /100 | #179 | Average 10.5% |
| Arabs | 45.3 /100 | #180 | Average 10.5% |
| Immigrants | Colombia | 44.1 /100 | #181 | Average 10.5% |
| Immigrants | Bulgaria | 43.8 /100 | #182 | Average 10.5% |
| Natives/Alaskans | 43.7 /100 | #183 | Average 10.5% |
| Immigrants | Nepal | 42.4 /100 | #184 | Average 10.5% |
| South Americans | 41.9 /100 | #185 | Average 10.5% |
| German Russians | 40.6 /100 | #186 | Average 10.5% |
| Immigrants | Poland | 38.4 /100 | #187 | Fair 10.6% |
| Immigrants | Armenia | 37.5 /100 | #188 | Fair 10.6% |
| Immigrants | Eritrea | 36.3 /100 | #189 | Fair 10.6% |
| Immigrants | North Macedonia | 34.6 /100 | #190 | Fair 10.6% |
| Immigrants | Northern Europe | 33.1 /100 | #191 | Fair 10.7% |
| Carpatho Rusyns | 32.1 /100 | #192 | Fair 10.7% |