Immigrants from Nigeria vs Immigrants from Turkey No Vehicles in Household
COMPARE
Immigrants from Nigeria
Immigrants from Turkey
No Vehicles in Household
No Vehicles in Household Comparison
Immigrants from Nigeria
Immigrants from Turkey
11.8%
NO VEHICLES IN HOUSEHOLD
1.9/ 100
METRIC RATING
249th/ 347
METRIC RANK
11.5%
NO VEHICLES IN HOUSEHOLD
4.8/ 100
METRIC RATING
232nd/ 347
METRIC RANK
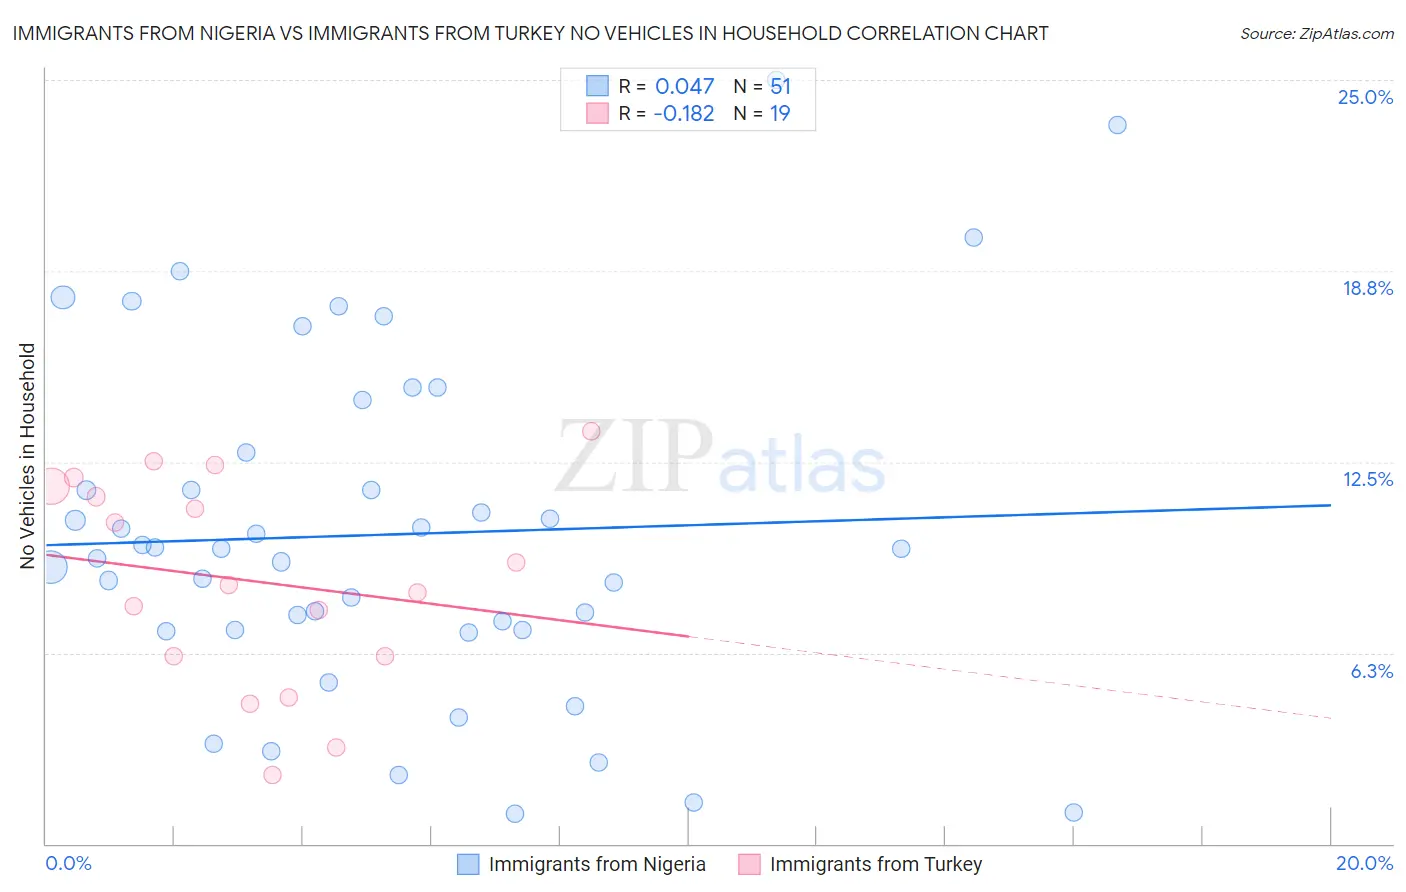
Immigrants from Nigeria vs Immigrants from Turkey No Vehicles in Household Correlation Chart
The statistical analysis conducted on geographies consisting of 283,041,250 people shows no correlation between the proportion of Immigrants from Nigeria and percentage of households with no vehicle available in the United States with a correlation coefficient (R) of 0.047 and weighted average of 11.8%. Similarly, the statistical analysis conducted on geographies consisting of 222,854,300 people shows a poor negative correlation between the proportion of Immigrants from Turkey and percentage of households with no vehicle available in the United States with a correlation coefficient (R) of -0.182 and weighted average of 11.5%, a difference of 2.9%.
No Vehicles in Household Correlation Summary
| Measurement | Immigrants from Nigeria | Immigrants from Turkey |
| Minimum | 0.97% | 2.2% |
| Maximum | 25.0% | 13.5% |
| Range | 24.0% | 11.3% |
| Mean | 10.1% | 8.6% |
| Median | 9.6% | 8.5% |
| Interquartile 25% (IQ1) | 7.0% | 6.1% |
| Interquartile 75% (IQ3) | 12.8% | 11.7% |
| Interquartile Range (IQR) | 5.8% | 5.6% |
| Standard Deviation (Sample) | 5.6% | 3.4% |
| Standard Deviation (Population) | 5.5% | 3.3% |
Demographics Similar to Immigrants from Nigeria and Immigrants from Turkey by No Vehicles in Household
In terms of no vehicles in household, the demographic groups most similar to Immigrants from Nigeria are Immigrants from Belgium (11.8%, a difference of 0.030%), Immigrants from Czechoslovakia (11.8%, a difference of 0.040%), Menominee (11.8%, a difference of 0.10%), Paiute (11.8%, a difference of 0.22%), and Immigrants from Honduras (11.8%, a difference of 0.26%). Similarly, the demographic groups most similar to Immigrants from Turkey are Houma (11.5%, a difference of 0.040%), Immigrants from Norway (11.4%, a difference of 0.19%), Immigrants from Japan (11.4%, a difference of 0.19%), Immigrants from Peru (11.5%, a difference of 0.23%), and Kiowa (11.5%, a difference of 0.61%).
| Demographics | Rating | Rank | No Vehicles in Household |
| Immigrants | Norway | 5.1 /100 | #230 | Tragic 11.4% |
| Immigrants | Japan | 5.1 /100 | #231 | Tragic 11.4% |
| Immigrants | Turkey | 4.8 /100 | #232 | Tragic 11.5% |
| Houma | 4.7 /100 | #233 | Tragic 11.5% |
| Immigrants | Peru | 4.5 /100 | #234 | Tragic 11.5% |
| Kiowa | 4.0 /100 | #235 | Tragic 11.5% |
| Cree | 3.5 /100 | #236 | Tragic 11.6% |
| Ute | 3.3 /100 | #237 | Tragic 11.6% |
| Russians | 3.2 /100 | #238 | Tragic 11.6% |
| Taiwanese | 2.8 /100 | #239 | Tragic 11.7% |
| Immigrants | Immigrants | 2.7 /100 | #240 | Tragic 11.7% |
| Eastern Europeans | 2.7 /100 | #241 | Tragic 11.7% |
| Turks | 2.6 /100 | #242 | Tragic 11.7% |
| Cheyenne | 2.4 /100 | #243 | Tragic 11.7% |
| Immigrants | Portugal | 2.2 /100 | #244 | Tragic 11.7% |
| Immigrants | Honduras | 2.1 /100 | #245 | Tragic 11.8% |
| Menominee | 2.0 /100 | #246 | Tragic 11.8% |
| Immigrants | Czechoslovakia | 2.0 /100 | #247 | Tragic 11.8% |
| Immigrants | Belgium | 1.9 /100 | #248 | Tragic 11.8% |
| Immigrants | Nigeria | 1.9 /100 | #249 | Tragic 11.8% |
| Paiute | 1.8 /100 | #250 | Tragic 11.8% |