Immigrants from Mexico vs Immigrants from Peru No Vehicles in Household
COMPARE
Immigrants from Mexico
Immigrants from Peru
No Vehicles in Household
No Vehicles in Household Comparison
Immigrants from Mexico
Immigrants from Peru
8.1%
NO VEHICLES IN HOUSEHOLD
99.8/ 100
METRIC RATING
58th/ 347
METRIC RANK
11.5%
NO VEHICLES IN HOUSEHOLD
4.5/ 100
METRIC RATING
234th/ 347
METRIC RANK
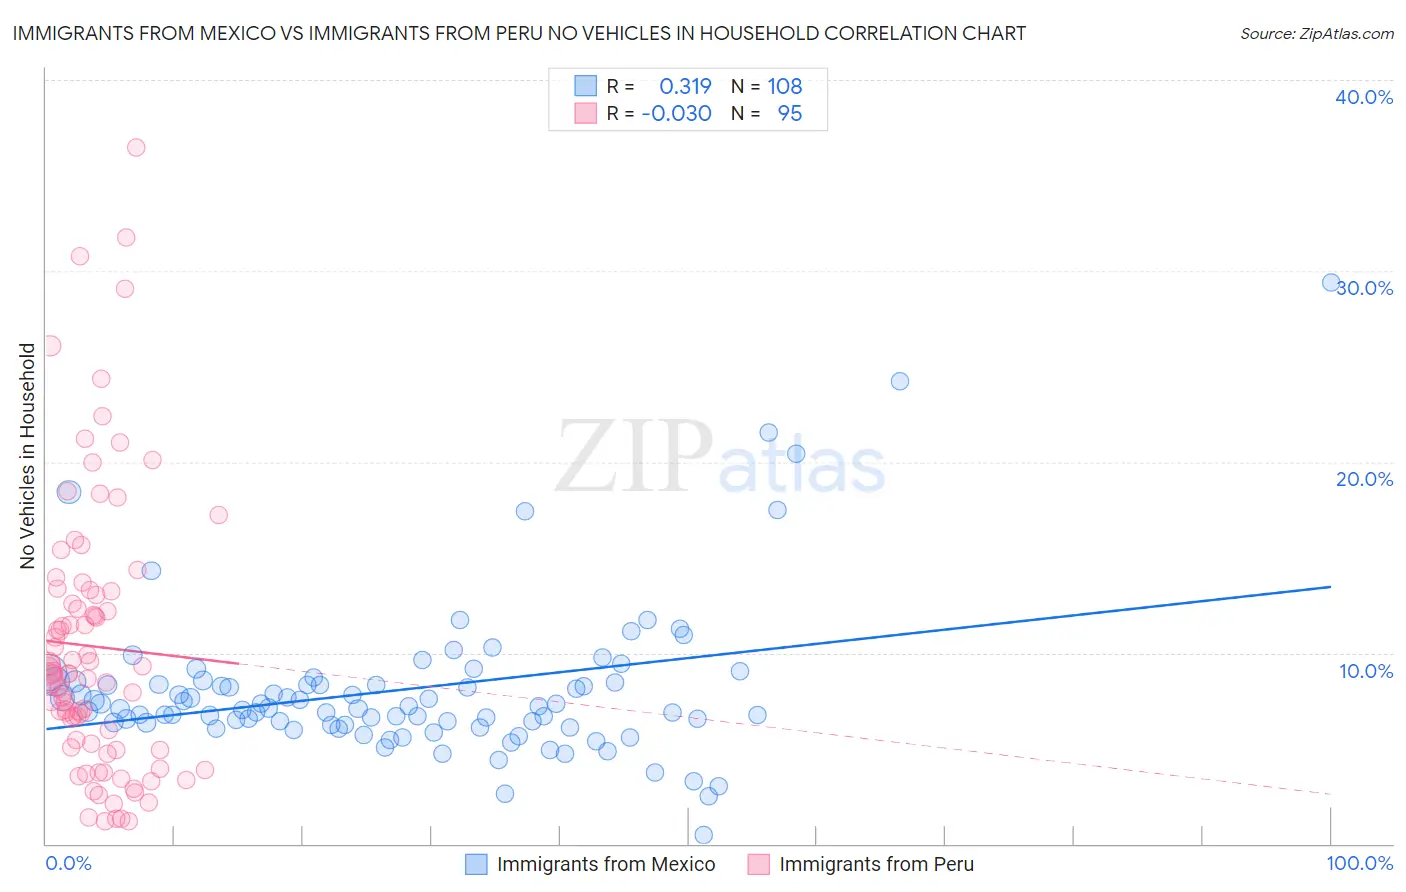
Immigrants from Mexico vs Immigrants from Peru No Vehicles in Household Correlation Chart
The statistical analysis conducted on geographies consisting of 510,868,339 people shows a mild positive correlation between the proportion of Immigrants from Mexico and percentage of households with no vehicle available in the United States with a correlation coefficient (R) of 0.319 and weighted average of 8.1%. Similarly, the statistical analysis conducted on geographies consisting of 328,351,491 people shows no correlation between the proportion of Immigrants from Peru and percentage of households with no vehicle available in the United States with a correlation coefficient (R) of -0.030 and weighted average of 11.5%, a difference of 41.2%.
No Vehicles in Household Correlation Summary
| Measurement | Immigrants from Mexico | Immigrants from Peru |
| Minimum | 0.44% | 1.1% |
| Maximum | 29.4% | 36.5% |
| Range | 29.0% | 35.3% |
| Mean | 8.1% | 10.3% |
| Median | 7.2% | 8.9% |
| Interquartile 25% (IQ1) | 6.3% | 5.1% |
| Interquartile 75% (IQ3) | 8.5% | 13.2% |
| Interquartile Range (IQR) | 2.2% | 8.2% |
| Standard Deviation (Sample) | 4.1% | 7.2% |
| Standard Deviation (Population) | 4.1% | 7.2% |
Similar Demographics by No Vehicles in Household
Demographics Similar to Immigrants from Mexico by No Vehicles in Household
In terms of no vehicles in household, the demographic groups most similar to Immigrants from Mexico are Venezuelan (8.1%, a difference of 0.11%), Immigrants from India (8.2%, a difference of 0.35%), Immigrants from Afghanistan (8.1%, a difference of 0.39%), Immigrants from Laos (8.2%, a difference of 0.42%), and Thai (8.2%, a difference of 0.59%).
| Demographics | Rating | Rank | No Vehicles in Household |
| Koreans | 99.9 /100 | #51 | Exceptional 8.0% |
| Hawaiians | 99.9 /100 | #52 | Exceptional 8.0% |
| Slovenes | 99.9 /100 | #53 | Exceptional 8.0% |
| Immigrants | Venezuela | 99.9 /100 | #54 | Exceptional 8.1% |
| Celtics | 99.9 /100 | #55 | Exceptional 8.1% |
| Immigrants | Afghanistan | 99.9 /100 | #56 | Exceptional 8.1% |
| Venezuelans | 99.8 /100 | #57 | Exceptional 8.1% |
| Immigrants | Mexico | 99.8 /100 | #58 | Exceptional 8.1% |
| Immigrants | India | 99.8 /100 | #59 | Exceptional 8.2% |
| Immigrants | Laos | 99.8 /100 | #60 | Exceptional 8.2% |
| Thais | 99.8 /100 | #61 | Exceptional 8.2% |
| Chinese | 99.8 /100 | #62 | Exceptional 8.2% |
| Slovaks | 99.8 /100 | #63 | Exceptional 8.3% |
| Croatians | 99.8 /100 | #64 | Exceptional 8.3% |
| Canadians | 99.7 /100 | #65 | Exceptional 8.3% |
Demographics Similar to Immigrants from Peru by No Vehicles in Household
In terms of no vehicles in household, the demographic groups most similar to Immigrants from Peru are Houma (11.5%, a difference of 0.19%), Immigrants from Turkey (11.5%, a difference of 0.23%), Kiowa (11.5%, a difference of 0.38%), Immigrants from Norway (11.4%, a difference of 0.42%), and Immigrants from Japan (11.4%, a difference of 0.42%).
| Demographics | Rating | Rank | No Vehicles in Household |
| Immigrants | Pakistan | 5.4 /100 | #227 | Tragic 11.4% |
| Immigrants | Romania | 5.3 /100 | #228 | Tragic 11.4% |
| Ugandans | 5.3 /100 | #229 | Tragic 11.4% |
| Immigrants | Norway | 5.1 /100 | #230 | Tragic 11.4% |
| Immigrants | Japan | 5.1 /100 | #231 | Tragic 11.4% |
| Immigrants | Turkey | 4.8 /100 | #232 | Tragic 11.5% |
| Houma | 4.7 /100 | #233 | Tragic 11.5% |
| Immigrants | Peru | 4.5 /100 | #234 | Tragic 11.5% |
| Kiowa | 4.0 /100 | #235 | Tragic 11.5% |
| Cree | 3.5 /100 | #236 | Tragic 11.6% |
| Ute | 3.3 /100 | #237 | Tragic 11.6% |
| Russians | 3.2 /100 | #238 | Tragic 11.6% |
| Taiwanese | 2.8 /100 | #239 | Tragic 11.7% |
| Immigrants | Immigrants | 2.7 /100 | #240 | Tragic 11.7% |
| Eastern Europeans | 2.7 /100 | #241 | Tragic 11.7% |