Immigrants from Mexico vs Barbadian No Vehicles in Household
COMPARE
Immigrants from Mexico
Barbadian
No Vehicles in Household
No Vehicles in Household Comparison
Immigrants from Mexico
Barbadians
8.1%
NO VEHICLES IN HOUSEHOLD
99.8/ 100
METRIC RATING
58th/ 347
METRIC RANK
26.1%
NO VEHICLES IN HOUSEHOLD
0.0/ 100
METRIC RATING
335th/ 347
METRIC RANK
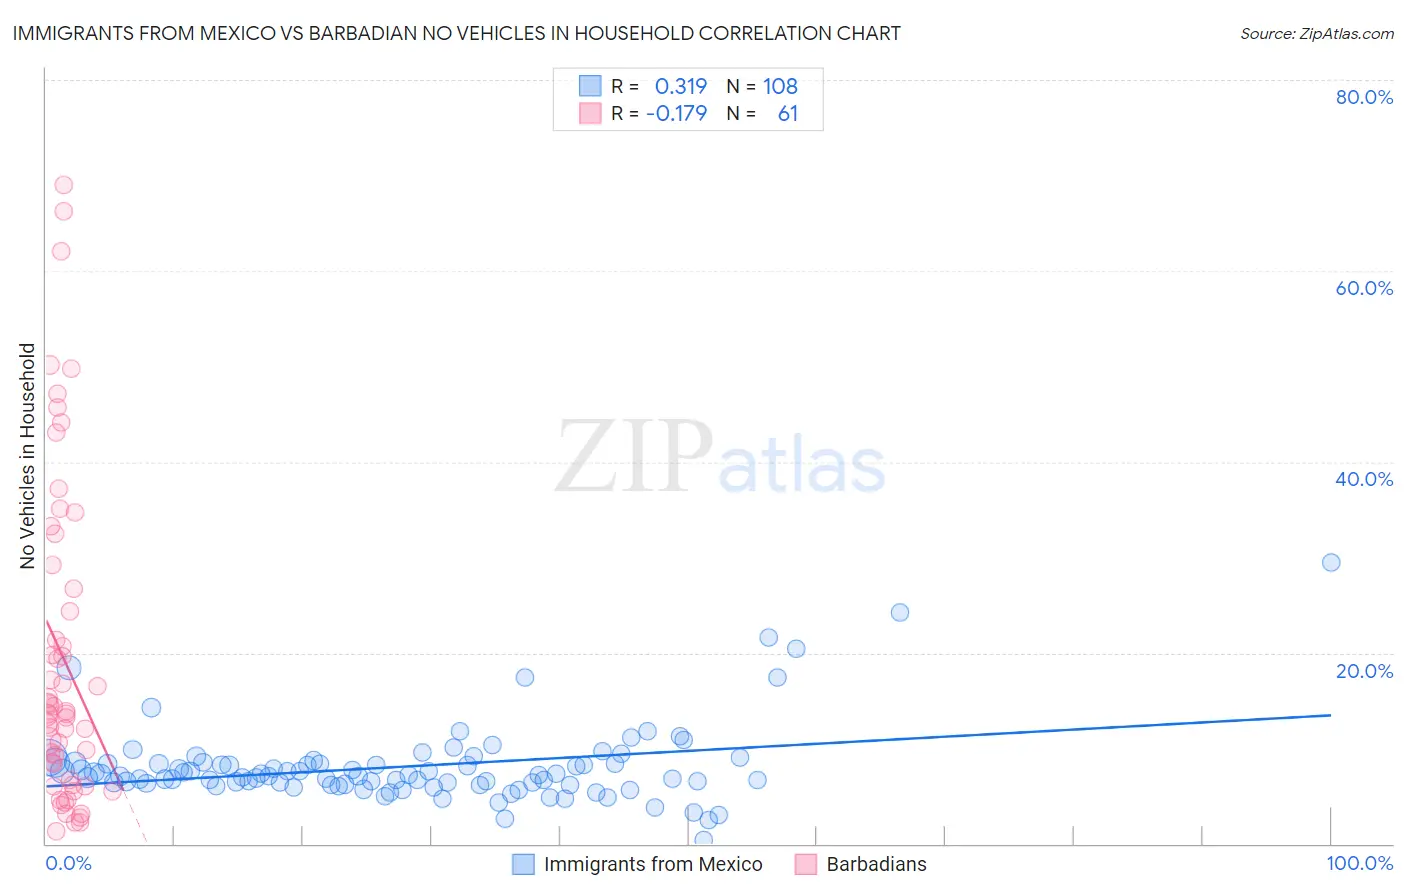
Immigrants from Mexico vs Barbadian No Vehicles in Household Correlation Chart
The statistical analysis conducted on geographies consisting of 510,868,339 people shows a mild positive correlation between the proportion of Immigrants from Mexico and percentage of households with no vehicle available in the United States with a correlation coefficient (R) of 0.319 and weighted average of 8.1%. Similarly, the statistical analysis conducted on geographies consisting of 141,232,978 people shows a poor negative correlation between the proportion of Barbadians and percentage of households with no vehicle available in the United States with a correlation coefficient (R) of -0.179 and weighted average of 26.1%, a difference of 220.6%.
No Vehicles in Household Correlation Summary
| Measurement | Immigrants from Mexico | Barbadian |
| Minimum | 0.44% | 1.3% |
| Maximum | 29.4% | 69.0% |
| Range | 29.0% | 67.7% |
| Mean | 8.1% | 19.5% |
| Median | 7.2% | 13.6% |
| Interquartile 25% (IQ1) | 6.3% | 6.4% |
| Interquartile 75% (IQ3) | 8.5% | 28.0% |
| Interquartile Range (IQR) | 2.2% | 21.6% |
| Standard Deviation (Sample) | 4.1% | 16.9% |
| Standard Deviation (Population) | 4.1% | 16.8% |
Similar Demographics by No Vehicles in Household
Demographics Similar to Immigrants from Mexico by No Vehicles in Household
In terms of no vehicles in household, the demographic groups most similar to Immigrants from Mexico are Venezuelan (8.1%, a difference of 0.11%), Immigrants from India (8.2%, a difference of 0.35%), Immigrants from Afghanistan (8.1%, a difference of 0.39%), Immigrants from Laos (8.2%, a difference of 0.42%), and Thai (8.2%, a difference of 0.59%).
| Demographics | Rating | Rank | No Vehicles in Household |
| Koreans | 99.9 /100 | #51 | Exceptional 8.0% |
| Hawaiians | 99.9 /100 | #52 | Exceptional 8.0% |
| Slovenes | 99.9 /100 | #53 | Exceptional 8.0% |
| Immigrants | Venezuela | 99.9 /100 | #54 | Exceptional 8.1% |
| Celtics | 99.9 /100 | #55 | Exceptional 8.1% |
| Immigrants | Afghanistan | 99.9 /100 | #56 | Exceptional 8.1% |
| Venezuelans | 99.8 /100 | #57 | Exceptional 8.1% |
| Immigrants | Mexico | 99.8 /100 | #58 | Exceptional 8.1% |
| Immigrants | India | 99.8 /100 | #59 | Exceptional 8.2% |
| Immigrants | Laos | 99.8 /100 | #60 | Exceptional 8.2% |
| Thais | 99.8 /100 | #61 | Exceptional 8.2% |
| Chinese | 99.8 /100 | #62 | Exceptional 8.2% |
| Slovaks | 99.8 /100 | #63 | Exceptional 8.3% |
| Croatians | 99.8 /100 | #64 | Exceptional 8.3% |
| Canadians | 99.7 /100 | #65 | Exceptional 8.3% |
Demographics Similar to Barbadians by No Vehicles in Household
In terms of no vehicles in household, the demographic groups most similar to Barbadians are Vietnamese (26.2%, a difference of 0.56%), Immigrants from Bangladesh (25.8%, a difference of 1.3%), Immigrants from Uzbekistan (26.7%, a difference of 2.2%), Immigrants from Trinidad and Tobago (24.6%, a difference of 5.9%), and Immigrants from Ecuador (23.8%, a difference of 9.5%).
| Demographics | Rating | Rank | No Vehicles in Household |
| Immigrants | Dominica | 0.0 /100 | #328 | Tragic 22.2% |
| Ecuadorians | 0.0 /100 | #329 | Tragic 22.8% |
| West Indians | 0.0 /100 | #330 | Tragic 23.7% |
| Trinidadians and Tobagonians | 0.0 /100 | #331 | Tragic 23.7% |
| Immigrants | Ecuador | 0.0 /100 | #332 | Tragic 23.8% |
| Immigrants | Trinidad and Tobago | 0.0 /100 | #333 | Tragic 24.6% |
| Immigrants | Bangladesh | 0.0 /100 | #334 | Tragic 25.8% |
| Barbadians | 0.0 /100 | #335 | Tragic 26.1% |
| Vietnamese | 0.0 /100 | #336 | Tragic 26.2% |
| Immigrants | Uzbekistan | 0.0 /100 | #337 | Tragic 26.7% |
| Guyanese | 0.0 /100 | #338 | Tragic 29.3% |
| Dominicans | 0.0 /100 | #339 | Tragic 29.4% |
| Immigrants | Barbados | 0.0 /100 | #340 | Tragic 29.5% |
| Immigrants | Guyana | 0.0 /100 | #341 | Tragic 29.5% |
| British West Indians | 0.0 /100 | #342 | Tragic 29.7% |