Immigrants from North America vs Immigrants from Peru No Vehicles in Household
COMPARE
Immigrants from North America
Immigrants from Peru
No Vehicles in Household
No Vehicles in Household Comparison
Immigrants from North America
Immigrants from Peru
8.7%
NO VEHICLES IN HOUSEHOLD
99.1/ 100
METRIC RATING
93rd/ 347
METRIC RANK
11.5%
NO VEHICLES IN HOUSEHOLD
4.5/ 100
METRIC RATING
234th/ 347
METRIC RANK
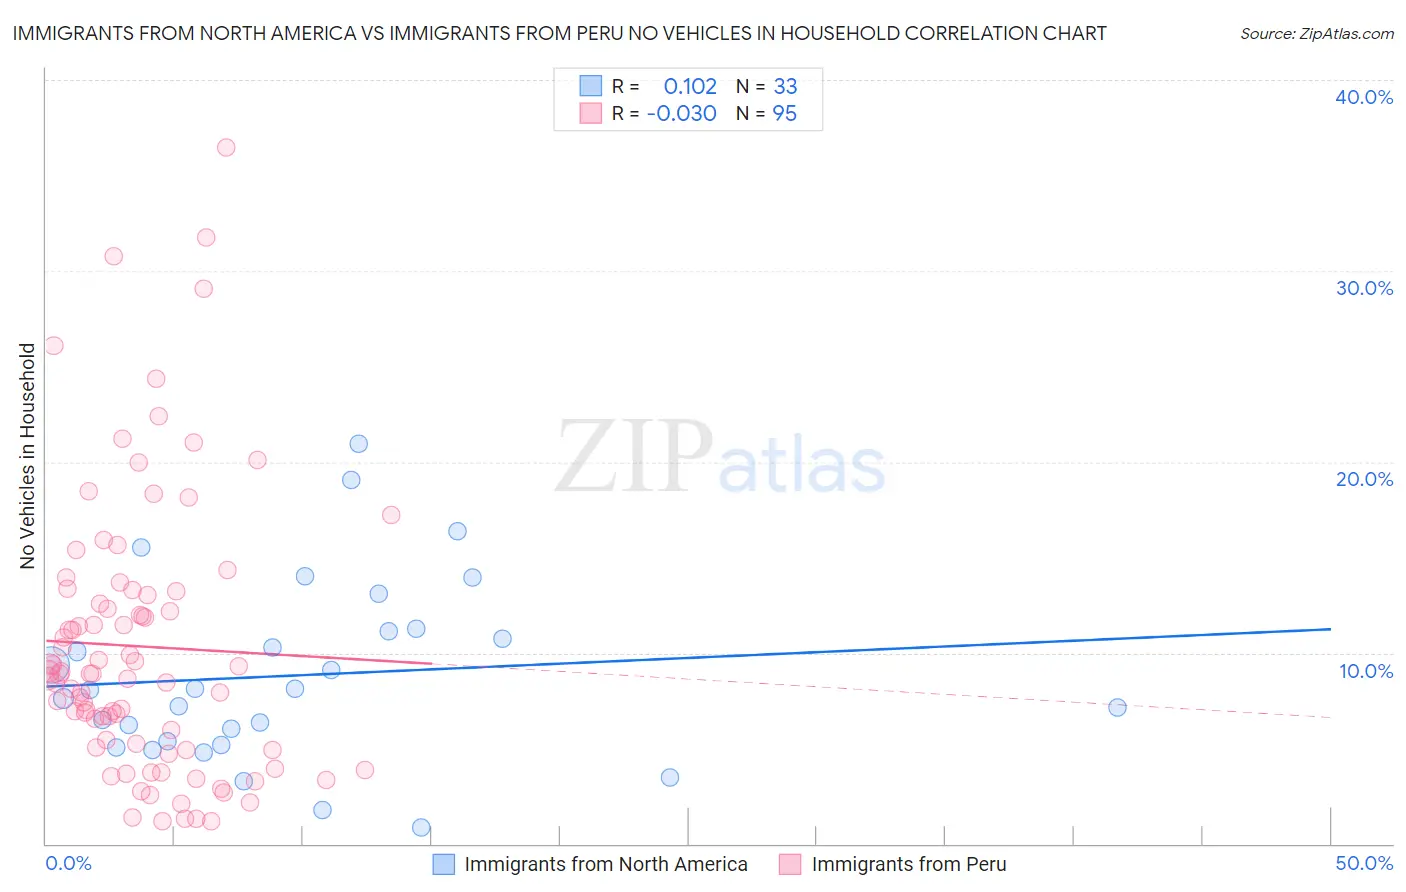
Immigrants from North America vs Immigrants from Peru No Vehicles in Household Correlation Chart
The statistical analysis conducted on geographies consisting of 460,580,509 people shows a poor positive correlation between the proportion of Immigrants from North America and percentage of households with no vehicle available in the United States with a correlation coefficient (R) of 0.102 and weighted average of 8.7%. Similarly, the statistical analysis conducted on geographies consisting of 328,351,491 people shows no correlation between the proportion of Immigrants from Peru and percentage of households with no vehicle available in the United States with a correlation coefficient (R) of -0.030 and weighted average of 11.5%, a difference of 31.3%.
No Vehicles in Household Correlation Summary
| Measurement | Immigrants from North America | Immigrants from Peru |
| Minimum | 0.85% | 1.1% |
| Maximum | 21.0% | 36.5% |
| Range | 20.1% | 35.3% |
| Mean | 8.8% | 10.3% |
| Median | 8.1% | 8.9% |
| Interquartile 25% (IQ1) | 5.3% | 5.1% |
| Interquartile 75% (IQ3) | 11.2% | 13.2% |
| Interquartile Range (IQR) | 5.9% | 8.2% |
| Standard Deviation (Sample) | 4.8% | 7.2% |
| Standard Deviation (Population) | 4.7% | 7.2% |
Similar Demographics by No Vehicles in Household
Demographics Similar to Immigrants from North America by No Vehicles in Household
In terms of no vehicles in household, the demographic groups most similar to Immigrants from North America are Immigrants from Canada (8.7%, a difference of 0.15%), Immigrants from Germany (8.7%, a difference of 0.17%), Bhutanese (8.7%, a difference of 0.36%), Immigrants from Cuba (8.7%, a difference of 0.45%), and Osage (8.7%, a difference of 0.59%).
| Demographics | Rating | Rank | No Vehicles in Household |
| Bangladeshis | 99.3 /100 | #86 | Exceptional 8.7% |
| Immigrants | England | 99.2 /100 | #87 | Exceptional 8.7% |
| Osage | 99.2 /100 | #88 | Exceptional 8.7% |
| Immigrants | Cuba | 99.2 /100 | #89 | Exceptional 8.7% |
| Bhutanese | 99.2 /100 | #90 | Exceptional 8.7% |
| Immigrants | Germany | 99.1 /100 | #91 | Exceptional 8.7% |
| Immigrants | Canada | 99.1 /100 | #92 | Exceptional 8.7% |
| Immigrants | North America | 99.1 /100 | #93 | Exceptional 8.7% |
| Austrians | 98.9 /100 | #94 | Exceptional 8.8% |
| Potawatomi | 98.8 /100 | #95 | Exceptional 8.8% |
| Immigrants | Bolivia | 98.7 /100 | #96 | Exceptional 8.9% |
| Immigrants | Central America | 98.5 /100 | #97 | Exceptional 8.9% |
| Slavs | 98.4 /100 | #98 | Exceptional 9.0% |
| Bulgarians | 98.4 /100 | #99 | Exceptional 9.0% |
| Asians | 98.3 /100 | #100 | Exceptional 9.0% |
Demographics Similar to Immigrants from Peru by No Vehicles in Household
In terms of no vehicles in household, the demographic groups most similar to Immigrants from Peru are Houma (11.5%, a difference of 0.19%), Immigrants from Turkey (11.5%, a difference of 0.23%), Kiowa (11.5%, a difference of 0.38%), Immigrants from Norway (11.4%, a difference of 0.42%), and Immigrants from Japan (11.4%, a difference of 0.42%).
| Demographics | Rating | Rank | No Vehicles in Household |
| Immigrants | Pakistan | 5.4 /100 | #227 | Tragic 11.4% |
| Immigrants | Romania | 5.3 /100 | #228 | Tragic 11.4% |
| Ugandans | 5.3 /100 | #229 | Tragic 11.4% |
| Immigrants | Norway | 5.1 /100 | #230 | Tragic 11.4% |
| Immigrants | Japan | 5.1 /100 | #231 | Tragic 11.4% |
| Immigrants | Turkey | 4.8 /100 | #232 | Tragic 11.5% |
| Houma | 4.7 /100 | #233 | Tragic 11.5% |
| Immigrants | Peru | 4.5 /100 | #234 | Tragic 11.5% |
| Kiowa | 4.0 /100 | #235 | Tragic 11.5% |
| Cree | 3.5 /100 | #236 | Tragic 11.6% |
| Ute | 3.3 /100 | #237 | Tragic 11.6% |
| Russians | 3.2 /100 | #238 | Tragic 11.6% |
| Taiwanese | 2.8 /100 | #239 | Tragic 11.7% |
| Immigrants | Immigrants | 2.7 /100 | #240 | Tragic 11.7% |
| Eastern Europeans | 2.7 /100 | #241 | Tragic 11.7% |