British vs Immigrants from Peru No Vehicles in Household
COMPARE
British
Immigrants from Peru
No Vehicles in Household
No Vehicles in Household Comparison
British
Immigrants from Peru
7.6%
NO VEHICLES IN HOUSEHOLD
100.0/ 100
METRIC RATING
27th/ 347
METRIC RANK
11.5%
NO VEHICLES IN HOUSEHOLD
4.5/ 100
METRIC RATING
234th/ 347
METRIC RANK
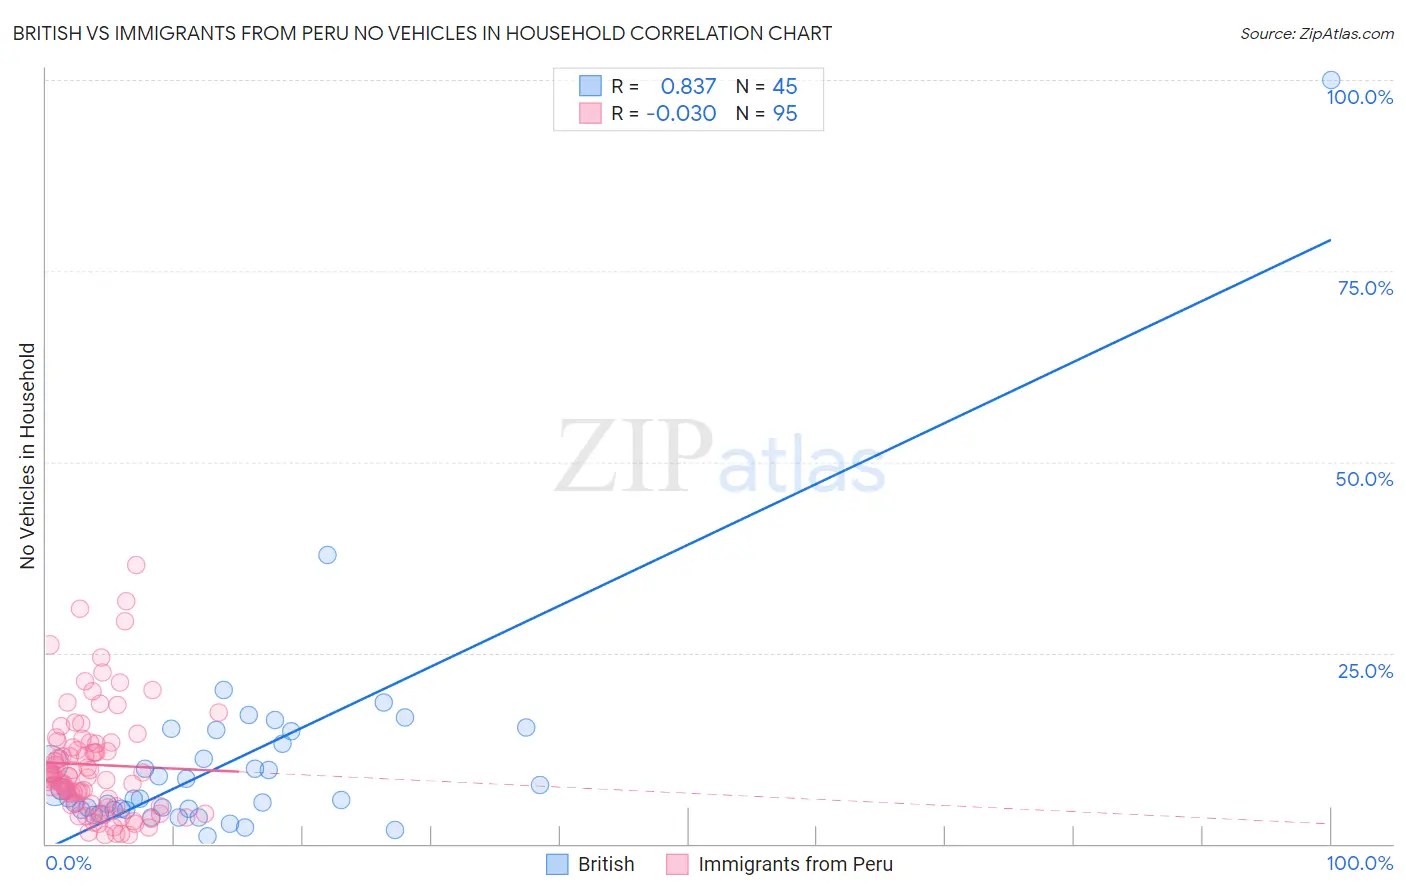
British vs Immigrants from Peru No Vehicles in Household Correlation Chart
The statistical analysis conducted on geographies consisting of 528,049,414 people shows a very strong positive correlation between the proportion of British and percentage of households with no vehicle available in the United States with a correlation coefficient (R) of 0.837 and weighted average of 7.6%. Similarly, the statistical analysis conducted on geographies consisting of 328,351,491 people shows no correlation between the proportion of Immigrants from Peru and percentage of households with no vehicle available in the United States with a correlation coefficient (R) of -0.030 and weighted average of 11.5%, a difference of 51.3%.
No Vehicles in Household Correlation Summary
| Measurement | British | Immigrants from Peru |
| Minimum | 1.0% | 1.1% |
| Maximum | 100.0% | 36.5% |
| Range | 99.0% | 35.3% |
| Mean | 10.8% | 10.3% |
| Median | 6.0% | 8.9% |
| Interquartile 25% (IQ1) | 4.5% | 5.1% |
| Interquartile 75% (IQ3) | 13.9% | 13.2% |
| Interquartile Range (IQR) | 9.4% | 8.2% |
| Standard Deviation (Sample) | 15.1% | 7.2% |
| Standard Deviation (Population) | 15.0% | 7.2% |
Similar Demographics by No Vehicles in Household
Demographics Similar to British by No Vehicles in Household
In terms of no vehicles in household, the demographic groups most similar to British are Sri Lankan (7.6%, a difference of 0.050%), Samoan (7.6%, a difference of 0.55%), American (7.7%, a difference of 0.84%), Finnish (7.7%, a difference of 1.1%), and Native Hawaiian (7.7%, a difference of 1.3%).
| Demographics | Rating | Rank | No Vehicles in Household |
| Ottawa | 100.0 /100 | #20 | Exceptional 7.4% |
| Nepalese | 100.0 /100 | #21 | Exceptional 7.4% |
| Irish | 100.0 /100 | #22 | Exceptional 7.4% |
| French | 100.0 /100 | #23 | Exceptional 7.4% |
| Immigrants | Iraq | 100.0 /100 | #24 | Exceptional 7.5% |
| Yaqui | 100.0 /100 | #25 | Exceptional 7.5% |
| Sri Lankans | 100.0 /100 | #26 | Exceptional 7.6% |
| British | 100.0 /100 | #27 | Exceptional 7.6% |
| Samoans | 100.0 /100 | #28 | Exceptional 7.6% |
| Americans | 100.0 /100 | #29 | Exceptional 7.7% |
| Finns | 100.0 /100 | #30 | Exceptional 7.7% |
| Native Hawaiians | 100.0 /100 | #31 | Exceptional 7.7% |
| Malaysians | 100.0 /100 | #32 | Exceptional 7.7% |
| Immigrants | Taiwan | 100.0 /100 | #33 | Exceptional 7.7% |
| Immigrants | Vietnam | 100.0 /100 | #34 | Exceptional 7.7% |
Demographics Similar to Immigrants from Peru by No Vehicles in Household
In terms of no vehicles in household, the demographic groups most similar to Immigrants from Peru are Houma (11.5%, a difference of 0.19%), Immigrants from Turkey (11.5%, a difference of 0.23%), Kiowa (11.5%, a difference of 0.38%), Immigrants from Norway (11.4%, a difference of 0.42%), and Immigrants from Japan (11.4%, a difference of 0.42%).
| Demographics | Rating | Rank | No Vehicles in Household |
| Immigrants | Pakistan | 5.4 /100 | #227 | Tragic 11.4% |
| Immigrants | Romania | 5.3 /100 | #228 | Tragic 11.4% |
| Ugandans | 5.3 /100 | #229 | Tragic 11.4% |
| Immigrants | Norway | 5.1 /100 | #230 | Tragic 11.4% |
| Immigrants | Japan | 5.1 /100 | #231 | Tragic 11.4% |
| Immigrants | Turkey | 4.8 /100 | #232 | Tragic 11.5% |
| Houma | 4.7 /100 | #233 | Tragic 11.5% |
| Immigrants | Peru | 4.5 /100 | #234 | Tragic 11.5% |
| Kiowa | 4.0 /100 | #235 | Tragic 11.5% |
| Cree | 3.5 /100 | #236 | Tragic 11.6% |
| Ute | 3.3 /100 | #237 | Tragic 11.6% |
| Russians | 3.2 /100 | #238 | Tragic 11.6% |
| Taiwanese | 2.8 /100 | #239 | Tragic 11.7% |
| Immigrants | Immigrants | 2.7 /100 | #240 | Tragic 11.7% |
| Eastern Europeans | 2.7 /100 | #241 | Tragic 11.7% |