Immigrants from Mexico vs Cypriot Family Households
COMPARE
Immigrants from Mexico
Cypriot
Family Households
Family Households Comparison
Immigrants from Mexico
Cypriots
69.1%
FAMILY HOUSEHOLDS
100.0/ 100
METRIC RATING
6th/ 347
METRIC RANK
63.2%
FAMILY HOUSEHOLDS
0.6/ 100
METRIC RATING
260th/ 347
METRIC RANK
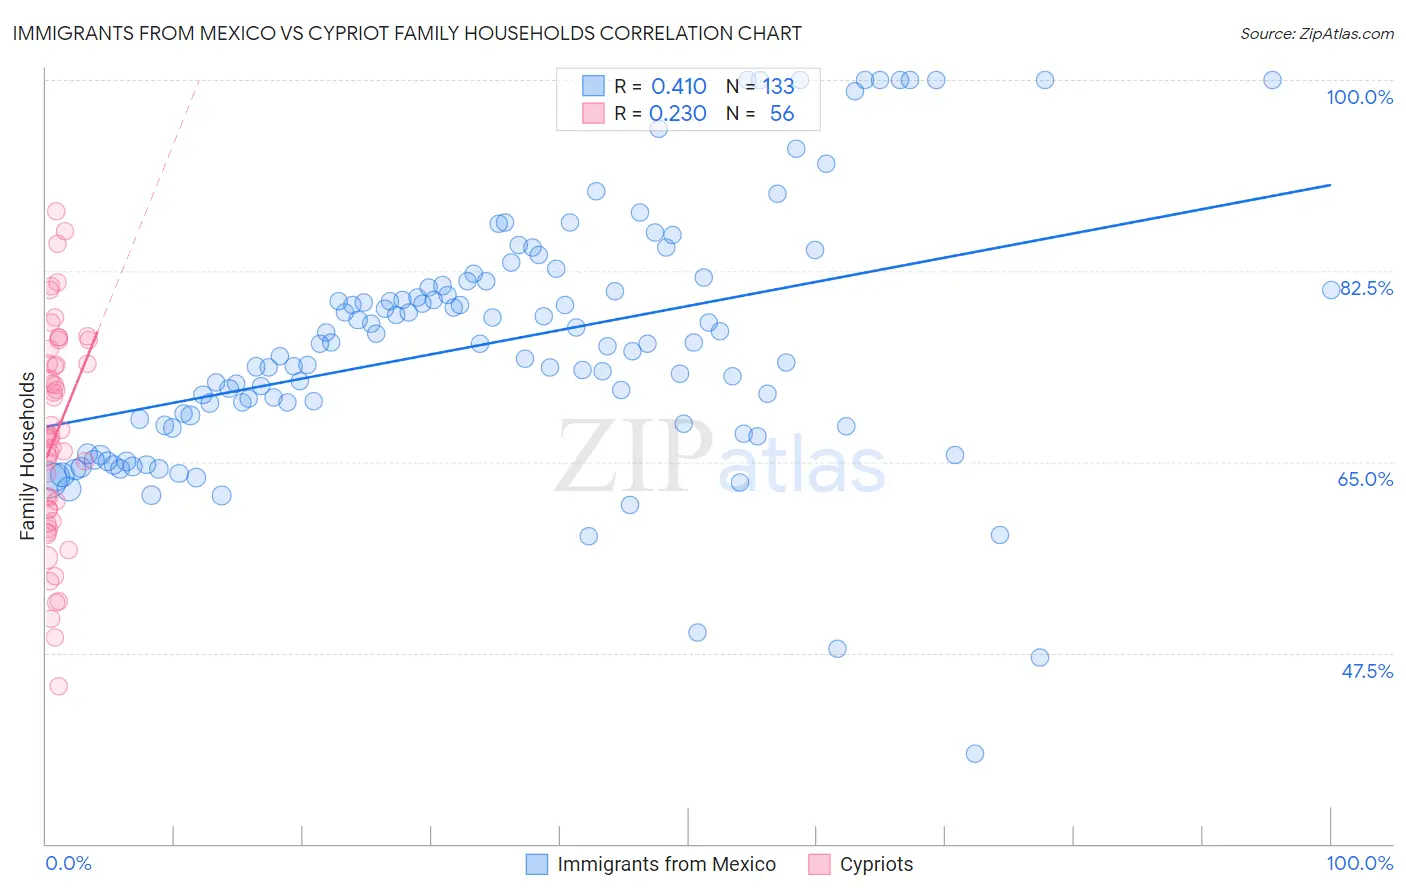
Immigrants from Mexico vs Cypriot Family Households Correlation Chart
The statistical analysis conducted on geographies consisting of 513,403,563 people shows a moderate positive correlation between the proportion of Immigrants from Mexico and percentage of family households in the United States with a correlation coefficient (R) of 0.410 and weighted average of 69.1%. Similarly, the statistical analysis conducted on geographies consisting of 61,857,015 people shows a weak positive correlation between the proportion of Cypriots and percentage of family households in the United States with a correlation coefficient (R) of 0.230 and weighted average of 63.2%, a difference of 9.4%.
Family Households Correlation Summary
| Measurement | Immigrants from Mexico | Cypriot |
| Minimum | 38.2% | 44.4% |
| Maximum | 100.0% | 87.9% |
| Range | 61.8% | 43.5% |
| Mean | 75.8% | 67.4% |
| Median | 75.8% | 67.3% |
| Interquartile 25% (IQ1) | 68.3% | 60.0% |
| Interquartile 75% (IQ3) | 81.4% | 74.7% |
| Interquartile Range (IQR) | 13.1% | 14.7% |
| Standard Deviation (Sample) | 11.6% | 9.9% |
| Standard Deviation (Population) | 11.6% | 9.8% |
Similar Demographics by Family Households
Demographics Similar to Immigrants from Mexico by Family Households
In terms of family households, the demographic groups most similar to Immigrants from Mexico are Mexican (69.0%, a difference of 0.21%), Yuman (69.3%, a difference of 0.24%), Yakama (69.3%, a difference of 0.26%), Immigrants from Fiji (68.8%, a difference of 0.53%), and Tongan (69.6%, a difference of 0.71%).
| Demographics | Rating | Rank | Family Households |
| Yup'ik | 100 /100 | #1 | Exceptional 72.4% |
| Spanish American Indians | 100.0 /100 | #2 | Exceptional 71.2% |
| Tongans | 100.0 /100 | #3 | Exceptional 69.6% |
| Yakama | 100.0 /100 | #4 | Exceptional 69.3% |
| Yuman | 100.0 /100 | #5 | Exceptional 69.3% |
| Immigrants | Mexico | 100.0 /100 | #6 | Exceptional 69.1% |
| Mexicans | 100.0 /100 | #7 | Exceptional 69.0% |
| Immigrants | Fiji | 100.0 /100 | #8 | Exceptional 68.8% |
| Native Hawaiians | 100.0 /100 | #9 | Exceptional 68.4% |
| Immigrants | Philippines | 100.0 /100 | #10 | Exceptional 68.3% |
| Immigrants | Central America | 100.0 /100 | #11 | Exceptional 68.3% |
| Koreans | 100.0 /100 | #12 | Exceptional 68.3% |
| Pueblo | 100.0 /100 | #13 | Exceptional 68.2% |
| Immigrants | Cuba | 100.0 /100 | #14 | Exceptional 68.2% |
| Assyrians/Chaldeans/Syriacs | 100.0 /100 | #15 | Exceptional 68.2% |
Demographics Similar to Cypriots by Family Households
In terms of family households, the demographic groups most similar to Cypriots are Immigrants from Western Europe (63.2%, a difference of 0.020%), Immigrants from Russia (63.2%, a difference of 0.020%), Immigrants from Barbados (63.2%, a difference of 0.030%), Immigrants from Ireland (63.2%, a difference of 0.030%), and Cheyenne (63.2%, a difference of 0.050%).
| Demographics | Rating | Rank | Family Households |
| Immigrants | Dominican Republic | 1.0 /100 | #253 | Tragic 63.3% |
| Slovaks | 1.0 /100 | #254 | Tragic 63.3% |
| Potawatomi | 1.0 /100 | #255 | Tragic 63.3% |
| Luxembourgers | 0.9 /100 | #256 | Tragic 63.3% |
| Icelanders | 0.8 /100 | #257 | Tragic 63.3% |
| Immigrants | Barbados | 0.7 /100 | #258 | Tragic 63.2% |
| Immigrants | Western Europe | 0.6 /100 | #259 | Tragic 63.2% |
| Cypriots | 0.6 /100 | #260 | Tragic 63.2% |
| Immigrants | Russia | 0.6 /100 | #261 | Tragic 63.2% |
| Immigrants | Ireland | 0.6 /100 | #262 | Tragic 63.2% |
| Cheyenne | 0.5 /100 | #263 | Tragic 63.2% |
| Kenyans | 0.5 /100 | #264 | Tragic 63.2% |
| Colville | 0.5 /100 | #265 | Tragic 63.2% |
| Immigrants | Western Africa | 0.5 /100 | #266 | Tragic 63.1% |
| Israelis | 0.4 /100 | #267 | Tragic 63.1% |