Immigrants from Mexico vs Black/African American 2 or more Vehicles in Household
COMPARE
Immigrants from Mexico
Black/African American
2 or more Vehicles in Household
2 or more Vehicles in Household Comparison
Immigrants from Mexico
Blacks/African Americans
60.2%
2 OR MORE VEHICLES IN HOUSEHOLD
100.0/ 100
METRIC RATING
33rd/ 347
METRIC RANK
50.9%
2 OR MORE VEHICLES IN HOUSEHOLD
0.0/ 100
METRIC RATING
293rd/ 347
METRIC RANK
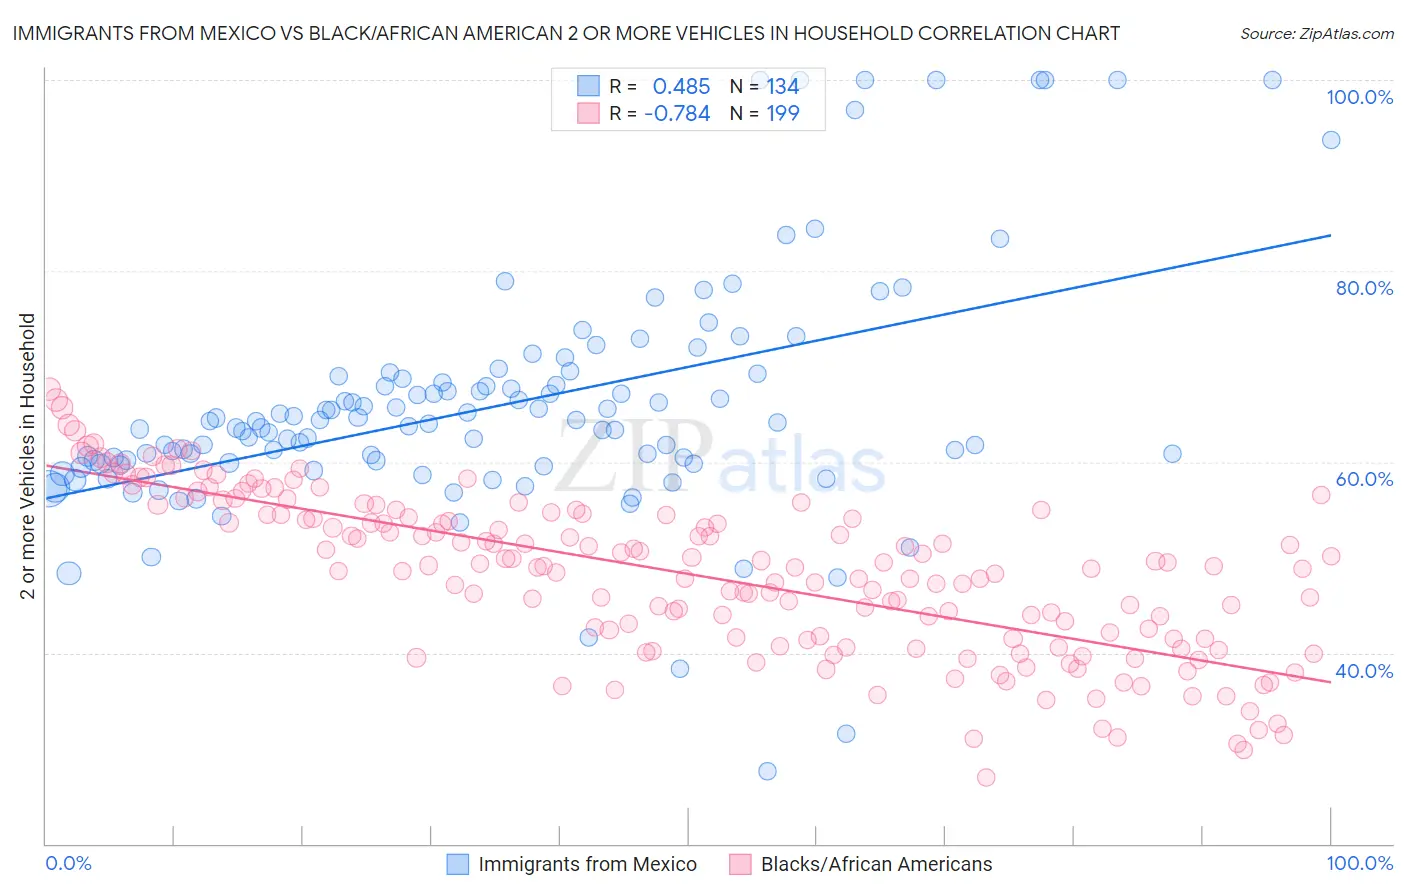
Immigrants from Mexico vs Black/African American 2 or more Vehicles in Household Correlation Chart
The statistical analysis conducted on geographies consisting of 513,439,462 people shows a moderate positive correlation between the proportion of Immigrants from Mexico and percentage of households with 2 or more vehicles available in the United States with a correlation coefficient (R) of 0.485 and weighted average of 60.2%. Similarly, the statistical analysis conducted on geographies consisting of 553,787,683 people shows a strong negative correlation between the proportion of Blacks/African Americans and percentage of households with 2 or more vehicles available in the United States with a correlation coefficient (R) of -0.784 and weighted average of 50.9%, a difference of 18.3%.
2 or more Vehicles in Household Correlation Summary
| Measurement | Immigrants from Mexico | Black/African American |
| Minimum | 27.6% | 26.9% |
| Maximum | 100.0% | 67.6% |
| Range | 72.4% | 40.7% |
| Mean | 65.8% | 48.2% |
| Median | 63.9% | 49.0% |
| Interquartile 25% (IQ1) | 59.9% | 41.5% |
| Interquartile 75% (IQ3) | 68.7% | 54.5% |
| Interquartile Range (IQR) | 8.9% | 13.0% |
| Standard Deviation (Sample) | 12.6% | 8.4% |
| Standard Deviation (Population) | 12.6% | 8.4% |
Similar Demographics by 2 or more Vehicles in Household
Demographics Similar to Immigrants from Mexico by 2 or more Vehicles in Household
In terms of 2 or more vehicles in household, the demographic groups most similar to Immigrants from Mexico are Spanish (60.2%, a difference of 0.050%), Arapaho (60.2%, a difference of 0.060%), Spanish American Indian (60.3%, a difference of 0.16%), Immigrants from Philippines (60.1%, a difference of 0.17%), and Finnish (60.3%, a difference of 0.19%).
| Demographics | Rating | Rank | 2 or more Vehicles in Household |
| Welsh | 100.0 /100 | #26 | Exceptional 60.8% |
| Assyrians/Chaldeans/Syriacs | 100.0 /100 | #27 | Exceptional 60.5% |
| Guamanians/Chamorros | 100.0 /100 | #28 | Exceptional 60.5% |
| Hawaiians | 100.0 /100 | #29 | Exceptional 60.4% |
| Finns | 100.0 /100 | #30 | Exceptional 60.3% |
| Spanish American Indians | 100.0 /100 | #31 | Exceptional 60.3% |
| Arapaho | 100.0 /100 | #32 | Exceptional 60.2% |
| Immigrants | Mexico | 100.0 /100 | #33 | Exceptional 60.2% |
| Spanish | 100.0 /100 | #34 | Exceptional 60.2% |
| Immigrants | Philippines | 100.0 /100 | #35 | Exceptional 60.1% |
| Chinese | 100.0 /100 | #36 | Exceptional 60.1% |
| Irish | 100.0 /100 | #37 | Exceptional 60.1% |
| Americans | 100.0 /100 | #38 | Exceptional 60.0% |
| British | 100.0 /100 | #39 | Exceptional 60.0% |
| Cherokee | 100.0 /100 | #40 | Exceptional 59.9% |
Demographics Similar to Blacks/African Americans by 2 or more Vehicles in Household
In terms of 2 or more vehicles in household, the demographic groups most similar to Blacks/African Americans are Immigrants from Ukraine (50.9%, a difference of 0.0%), Belizean (51.0%, a difference of 0.33%), Immigrants from Panama (51.1%, a difference of 0.37%), Somali (51.1%, a difference of 0.43%), and Bermudan (50.6%, a difference of 0.56%).
| Demographics | Rating | Rank | 2 or more Vehicles in Household |
| Immigrants | Liberia | 0.1 /100 | #286 | Tragic 51.3% |
| Immigrants | Serbia | 0.1 /100 | #287 | Tragic 51.3% |
| Okinawans | 0.1 /100 | #288 | Tragic 51.2% |
| Somalis | 0.0 /100 | #289 | Tragic 51.1% |
| Immigrants | Panama | 0.0 /100 | #290 | Tragic 51.1% |
| Belizeans | 0.0 /100 | #291 | Tragic 51.0% |
| Immigrants | Ukraine | 0.0 /100 | #292 | Tragic 50.9% |
| Blacks/African Americans | 0.0 /100 | #293 | Tragic 50.9% |
| Bermudans | 0.0 /100 | #294 | Tragic 50.6% |
| Cypriots | 0.0 /100 | #295 | Tragic 50.6% |
| Immigrants | Somalia | 0.0 /100 | #296 | Tragic 50.5% |
| Immigrants | Spain | 0.0 /100 | #297 | Tragic 50.4% |
| Paraguayans | 0.0 /100 | #298 | Tragic 50.3% |
| Immigrants | Morocco | 0.0 /100 | #299 | Tragic 50.3% |
| Immigrants | Russia | 0.0 /100 | #300 | Tragic 50.3% |