Immigrants from Mexico vs Slavic 2 or more Vehicles in Household
COMPARE
Immigrants from Mexico
Slavic
2 or more Vehicles in Household
2 or more Vehicles in Household Comparison
Immigrants from Mexico
Slavs
60.2%
2 OR MORE VEHICLES IN HOUSEHOLD
100.0/ 100
METRIC RATING
33rd/ 347
METRIC RANK
57.8%
2 OR MORE VEHICLES IN HOUSEHOLD
98.8/ 100
METRIC RATING
97th/ 347
METRIC RANK
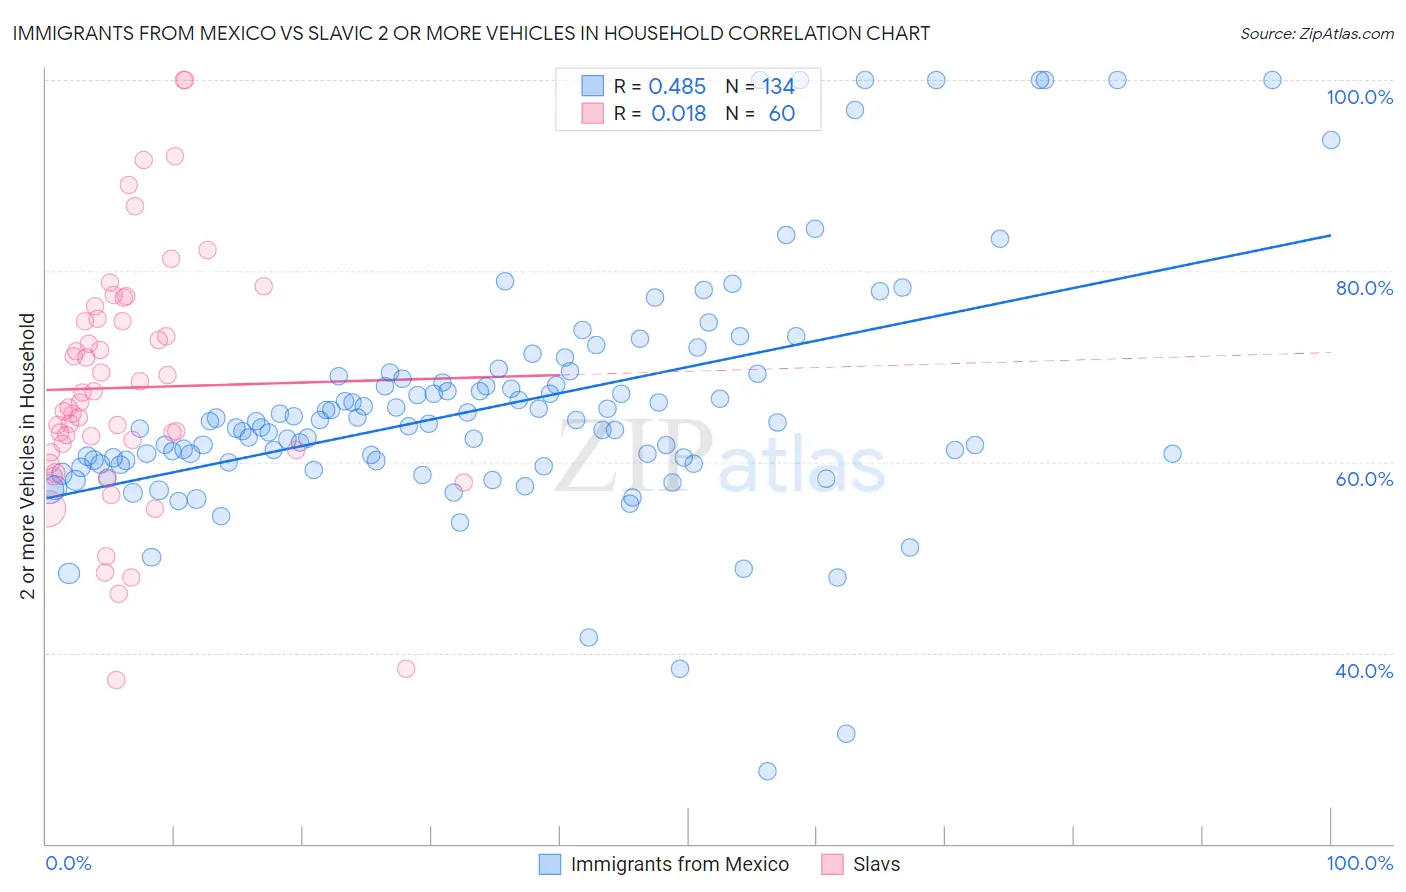
Immigrants from Mexico vs Slavic 2 or more Vehicles in Household Correlation Chart
The statistical analysis conducted on geographies consisting of 513,439,462 people shows a moderate positive correlation between the proportion of Immigrants from Mexico and percentage of households with 2 or more vehicles available in the United States with a correlation coefficient (R) of 0.485 and weighted average of 60.2%. Similarly, the statistical analysis conducted on geographies consisting of 270,821,936 people shows no correlation between the proportion of Slavs and percentage of households with 2 or more vehicles available in the United States with a correlation coefficient (R) of 0.018 and weighted average of 57.8%, a difference of 4.2%.
2 or more Vehicles in Household Correlation Summary
| Measurement | Immigrants from Mexico | Slavic |
| Minimum | 27.6% | 37.2% |
| Maximum | 100.0% | 100.0% |
| Range | 72.4% | 62.8% |
| Mean | 65.8% | 67.8% |
| Median | 63.9% | 66.0% |
| Interquartile 25% (IQ1) | 59.9% | 61.1% |
| Interquartile 75% (IQ3) | 68.7% | 74.9% |
| Interquartile Range (IQR) | 8.9% | 13.7% |
| Standard Deviation (Sample) | 12.6% | 12.9% |
| Standard Deviation (Population) | 12.6% | 12.8% |
Similar Demographics by 2 or more Vehicles in Household
Demographics Similar to Immigrants from Mexico by 2 or more Vehicles in Household
In terms of 2 or more vehicles in household, the demographic groups most similar to Immigrants from Mexico are Spanish (60.2%, a difference of 0.050%), Arapaho (60.2%, a difference of 0.060%), Spanish American Indian (60.3%, a difference of 0.16%), Immigrants from Philippines (60.1%, a difference of 0.17%), and Finnish (60.3%, a difference of 0.19%).
| Demographics | Rating | Rank | 2 or more Vehicles in Household |
| Welsh | 100.0 /100 | #26 | Exceptional 60.8% |
| Assyrians/Chaldeans/Syriacs | 100.0 /100 | #27 | Exceptional 60.5% |
| Guamanians/Chamorros | 100.0 /100 | #28 | Exceptional 60.5% |
| Hawaiians | 100.0 /100 | #29 | Exceptional 60.4% |
| Finns | 100.0 /100 | #30 | Exceptional 60.3% |
| Spanish American Indians | 100.0 /100 | #31 | Exceptional 60.3% |
| Arapaho | 100.0 /100 | #32 | Exceptional 60.2% |
| Immigrants | Mexico | 100.0 /100 | #33 | Exceptional 60.2% |
| Spanish | 100.0 /100 | #34 | Exceptional 60.2% |
| Immigrants | Philippines | 100.0 /100 | #35 | Exceptional 60.1% |
| Chinese | 100.0 /100 | #36 | Exceptional 60.1% |
| Irish | 100.0 /100 | #37 | Exceptional 60.1% |
| Americans | 100.0 /100 | #38 | Exceptional 60.0% |
| British | 100.0 /100 | #39 | Exceptional 60.0% |
| Cherokee | 100.0 /100 | #40 | Exceptional 59.9% |
Demographics Similar to Slavs by 2 or more Vehicles in Household
In terms of 2 or more vehicles in household, the demographic groups most similar to Slavs are Burmese (57.8%, a difference of 0.020%), Hmong (57.8%, a difference of 0.060%), Filipino (57.8%, a difference of 0.080%), Ottawa (57.9%, a difference of 0.14%), and Shoshone (57.9%, a difference of 0.15%).
| Demographics | Rating | Rank | 2 or more Vehicles in Household |
| Hispanics or Latinos | 99.0 /100 | #90 | Exceptional 57.9% |
| Pakistanis | 99.0 /100 | #91 | Exceptional 57.9% |
| Shoshone | 99.0 /100 | #92 | Exceptional 57.9% |
| Ottawa | 99.0 /100 | #93 | Exceptional 57.9% |
| Filipinos | 98.9 /100 | #94 | Exceptional 57.8% |
| Hmong | 98.9 /100 | #95 | Exceptional 57.8% |
| Burmese | 98.8 /100 | #96 | Exceptional 57.8% |
| Slavs | 98.8 /100 | #97 | Exceptional 57.8% |
| Palestinians | 98.6 /100 | #98 | Exceptional 57.7% |
| Cajuns | 98.5 /100 | #99 | Exceptional 57.7% |
| Fijians | 98.4 /100 | #100 | Exceptional 57.6% |
| Lebanese | 98.3 /100 | #101 | Exceptional 57.6% |
| Immigrants | Bolivia | 98.2 /100 | #102 | Exceptional 57.6% |
| Jordanians | 98.2 /100 | #103 | Exceptional 57.6% |
| Immigrants | Indonesia | 98.2 /100 | #104 | Exceptional 57.6% |