Immigrants from Malaysia vs Kenyan 1 or more Vehicles in Household
COMPARE
Immigrants from Malaysia
Kenyan
1 or more Vehicles in Household
1 or more Vehicles in Household Comparison
Immigrants from Malaysia
Kenyans
86.5%
1 OR MORE VEHICLES IN HOUSEHOLD
0.0/ 100
METRIC RATING
287th/ 347
METRIC RANK
90.4%
1 OR MORE VEHICLES IN HOUSEHOLD
87.0/ 100
METRIC RATING
134th/ 347
METRIC RANK
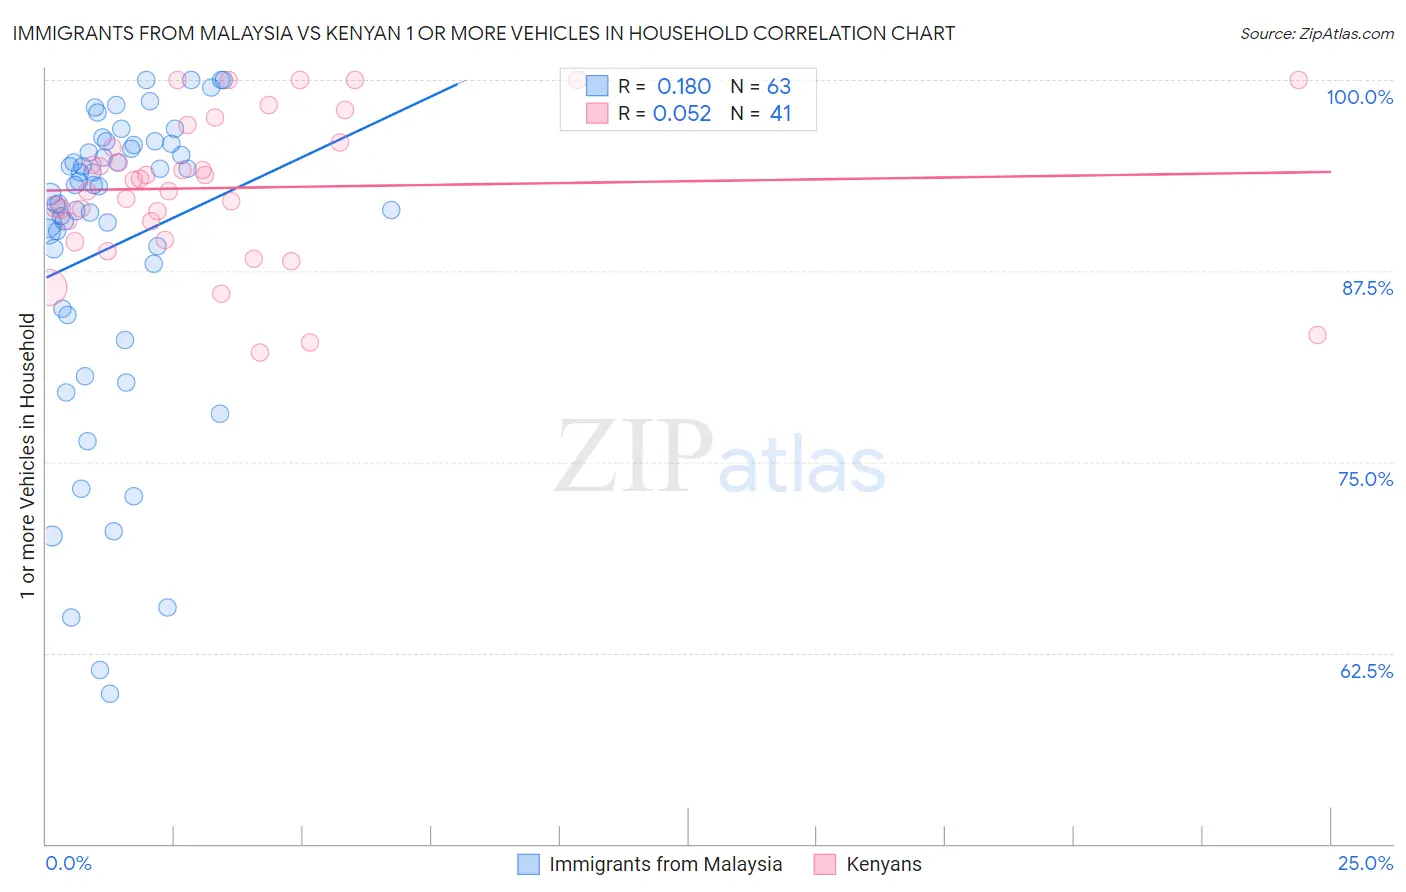
Immigrants from Malaysia vs Kenyan 1 or more Vehicles in Household Correlation Chart
The statistical analysis conducted on geographies consisting of 197,926,465 people shows a poor positive correlation between the proportion of Immigrants from Malaysia and percentage of households with 1 or more vehicles available in the United States with a correlation coefficient (R) of 0.180 and weighted average of 86.5%. Similarly, the statistical analysis conducted on geographies consisting of 168,180,305 people shows a slight positive correlation between the proportion of Kenyans and percentage of households with 1 or more vehicles available in the United States with a correlation coefficient (R) of 0.052 and weighted average of 90.4%, a difference of 4.5%.
1 or more Vehicles in Household Correlation Summary
| Measurement | Immigrants from Malaysia | Kenyan |
| Minimum | 59.8% | 82.2% |
| Maximum | 100.0% | 100.0% |
| Range | 40.2% | 17.8% |
| Mean | 89.2% | 93.0% |
| Median | 93.0% | 93.4% |
| Interquartile 25% (IQ1) | 85.0% | 90.1% |
| Interquartile 75% (IQ3) | 95.7% | 96.5% |
| Interquartile Range (IQR) | 10.7% | 6.4% |
| Standard Deviation (Sample) | 10.1% | 4.8% |
| Standard Deviation (Population) | 10.0% | 4.8% |
Similar Demographics by 1 or more Vehicles in Household
Demographics Similar to Immigrants from Malaysia by 1 or more Vehicles in Household
In terms of 1 or more vehicles in household, the demographic groups most similar to Immigrants from Malaysia are Hopi (86.4%, a difference of 0.070%), Immigrants from Eastern Asia (86.5%, a difference of 0.080%), Immigrants from Ireland (86.4%, a difference of 0.090%), Immigrants from Kazakhstan (86.6%, a difference of 0.11%), and Immigrants from Australia (86.4%, a difference of 0.13%).
| Demographics | Rating | Rank | 1 or more Vehicles in Household |
| Immigrants | Croatia | 0.0 /100 | #280 | Tragic 87.0% |
| Mongolians | 0.0 /100 | #281 | Tragic 87.0% |
| Colville | 0.0 /100 | #282 | Tragic 86.8% |
| Immigrants | Eastern Europe | 0.0 /100 | #283 | Tragic 86.7% |
| Central American Indians | 0.0 /100 | #284 | Tragic 86.7% |
| Immigrants | Kazakhstan | 0.0 /100 | #285 | Tragic 86.6% |
| Immigrants | Eastern Asia | 0.0 /100 | #286 | Tragic 86.5% |
| Immigrants | Malaysia | 0.0 /100 | #287 | Tragic 86.5% |
| Hopi | 0.0 /100 | #288 | Tragic 86.4% |
| Immigrants | Ireland | 0.0 /100 | #289 | Tragic 86.4% |
| Immigrants | Australia | 0.0 /100 | #290 | Tragic 86.4% |
| Pima | 0.0 /100 | #291 | Tragic 86.3% |
| Okinawans | 0.0 /100 | #292 | Tragic 86.1% |
| Indians (Asian) | 0.0 /100 | #293 | Tragic 86.0% |
| Alaskan Athabascans | 0.0 /100 | #294 | Tragic 86.0% |
Demographics Similar to Kenyans by 1 or more Vehicles in Household
In terms of 1 or more vehicles in household, the demographic groups most similar to Kenyans are Immigrants from Oceania (90.4%, a difference of 0.0%), Immigrants from Syria (90.4%, a difference of 0.020%), Hungarian (90.3%, a difference of 0.020%), Latvian (90.3%, a difference of 0.020%), and Syrian (90.3%, a difference of 0.020%).
| Demographics | Rating | Rank | 1 or more Vehicles in Household |
| Immigrants | Azores | 89.1 /100 | #127 | Excellent 90.4% |
| Burmese | 89.0 /100 | #128 | Excellent 90.4% |
| Marshallese | 88.9 /100 | #129 | Excellent 90.4% |
| Nicaraguans | 88.8 /100 | #130 | Excellent 90.4% |
| Immigrants | Kenya | 88.5 /100 | #131 | Excellent 90.4% |
| Immigrants | South Africa | 88.1 /100 | #132 | Excellent 90.4% |
| Immigrants | Syria | 87.5 /100 | #133 | Excellent 90.4% |
| Kenyans | 87.0 /100 | #134 | Excellent 90.4% |
| Immigrants | Oceania | 86.9 /100 | #135 | Excellent 90.4% |
| Hungarians | 86.5 /100 | #136 | Excellent 90.3% |
| Latvians | 86.3 /100 | #137 | Excellent 90.3% |
| Syrians | 86.3 /100 | #138 | Excellent 90.3% |
| Estonians | 85.6 /100 | #139 | Excellent 90.3% |
| Sudanese | 85.2 /100 | #140 | Excellent 90.3% |
| Immigrants | Moldova | 83.1 /100 | #141 | Excellent 90.2% |