Immigrants from Jamaica vs Immigrants from Greece 1 or more Vehicles in Household
COMPARE
Immigrants from Jamaica
Immigrants from Greece
1 or more Vehicles in Household
1 or more Vehicles in Household Comparison
Immigrants from Jamaica
Immigrants from Greece
85.8%
1 OR MORE VEHICLES IN HOUSEHOLD
0.0/ 100
METRIC RATING
295th/ 347
METRIC RANK
85.4%
1 OR MORE VEHICLES IN HOUSEHOLD
0.0/ 100
METRIC RATING
303rd/ 347
METRIC RANK
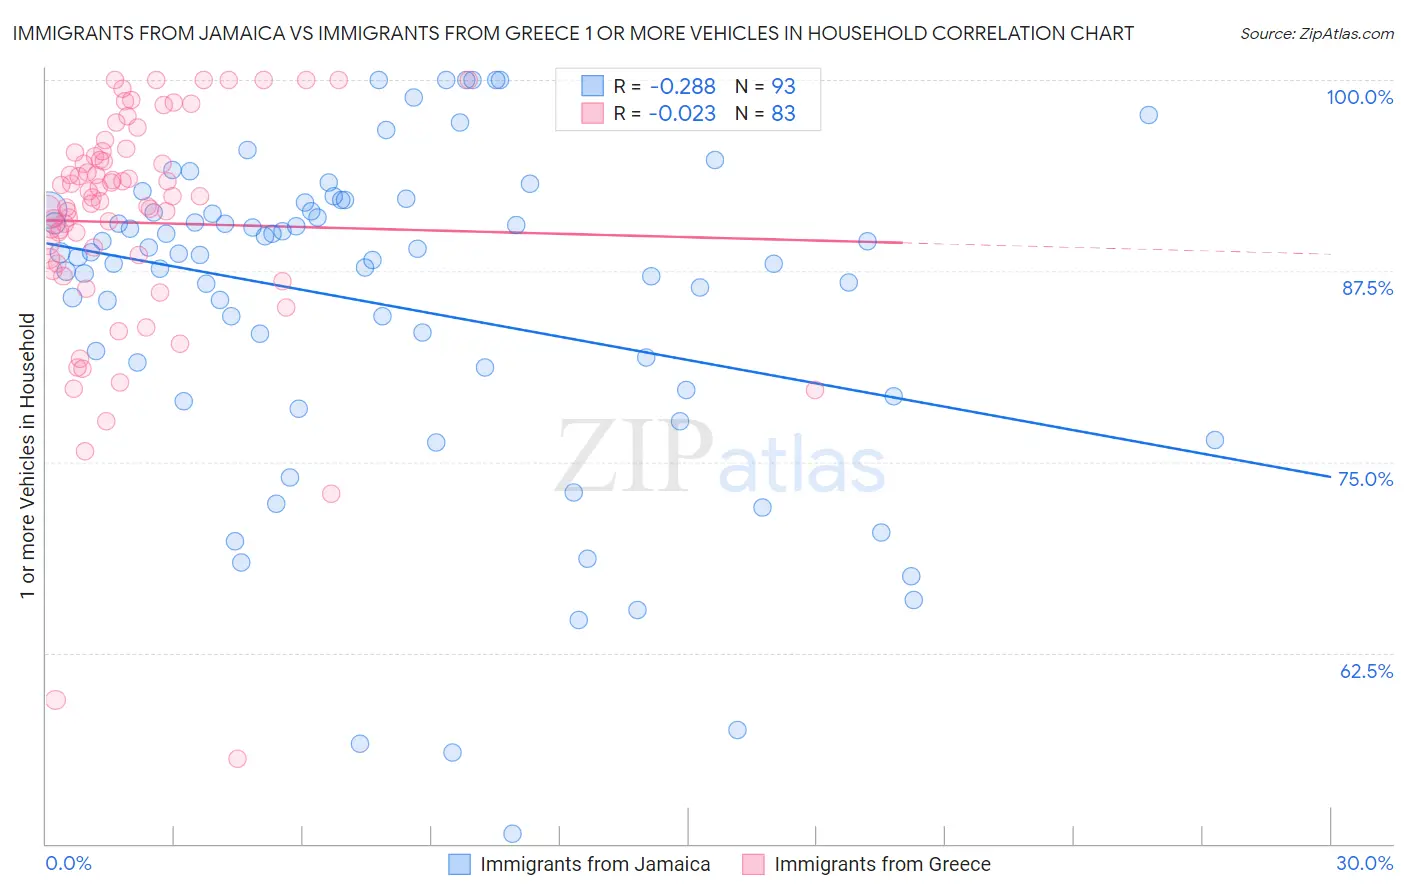
Immigrants from Jamaica vs Immigrants from Greece 1 or more Vehicles in Household Correlation Chart
The statistical analysis conducted on geographies consisting of 291,409,527 people shows a weak negative correlation between the proportion of Immigrants from Jamaica and percentage of households with 1 or more vehicles available in the United States with a correlation coefficient (R) of -0.288 and weighted average of 85.8%. Similarly, the statistical analysis conducted on geographies consisting of 216,749,502 people shows no correlation between the proportion of Immigrants from Greece and percentage of households with 1 or more vehicles available in the United States with a correlation coefficient (R) of -0.023 and weighted average of 85.4%, a difference of 0.54%.
1 or more Vehicles in Household Correlation Summary
| Measurement | Immigrants from Jamaica | Immigrants from Greece |
| Minimum | 50.6% | 55.5% |
| Maximum | 100.0% | 100.0% |
| Range | 49.4% | 44.5% |
| Mean | 85.3% | 90.7% |
| Median | 88.5% | 92.3% |
| Interquartile 25% (IQ1) | 80.4% | 88.0% |
| Interquartile 75% (IQ3) | 91.4% | 95.3% |
| Interquartile Range (IQR) | 11.0% | 7.3% |
| Standard Deviation (Sample) | 10.7% | 8.1% |
| Standard Deviation (Population) | 10.7% | 8.0% |
Demographics Similar to Immigrants from Jamaica and Immigrants from Greece by 1 or more Vehicles in Household
In terms of 1 or more vehicles in household, the demographic groups most similar to Immigrants from Jamaica are Immigrants from Spain (85.8%, a difference of 0.030%), Paraguayan (85.7%, a difference of 0.12%), Alaskan Athabascan (86.0%, a difference of 0.17%), Belizean (85.7%, a difference of 0.20%), and Indian (Asian) (86.0%, a difference of 0.24%). Similarly, the demographic groups most similar to Immigrants from Greece are Moroccan (85.4%, a difference of 0.030%), Immigrants from Panama (85.4%, a difference of 0.050%), Immigrants from Russia (85.4%, a difference of 0.090%), Yuman (85.5%, a difference of 0.10%), and Immigrants from Ukraine (85.2%, a difference of 0.17%).
| Demographics | Rating | Rank | 1 or more Vehicles in Household |
| Immigrants | Ireland | 0.0 /100 | #289 | Tragic 86.4% |
| Immigrants | Australia | 0.0 /100 | #290 | Tragic 86.4% |
| Pima | 0.0 /100 | #291 | Tragic 86.3% |
| Okinawans | 0.0 /100 | #292 | Tragic 86.1% |
| Indians (Asian) | 0.0 /100 | #293 | Tragic 86.0% |
| Alaskan Athabascans | 0.0 /100 | #294 | Tragic 86.0% |
| Immigrants | Jamaica | 0.0 /100 | #295 | Tragic 85.8% |
| Immigrants | Spain | 0.0 /100 | #296 | Tragic 85.8% |
| Paraguayans | 0.0 /100 | #297 | Tragic 85.7% |
| Belizeans | 0.0 /100 | #298 | Tragic 85.7% |
| Yuman | 0.0 /100 | #299 | Tragic 85.5% |
| Immigrants | Russia | 0.0 /100 | #300 | Tragic 85.4% |
| Immigrants | Panama | 0.0 /100 | #301 | Tragic 85.4% |
| Moroccans | 0.0 /100 | #302 | Tragic 85.4% |
| Immigrants | Greece | 0.0 /100 | #303 | Tragic 85.4% |
| Immigrants | Ukraine | 0.0 /100 | #304 | Tragic 85.2% |
| Immigrants | China | 0.0 /100 | #305 | Tragic 84.9% |
| Immigrants | Western Africa | 0.0 /100 | #306 | Tragic 84.9% |
| Tohono O'odham | 0.0 /100 | #307 | Tragic 84.7% |
| Immigrants | Belize | 0.0 /100 | #308 | Tragic 84.7% |
| Immigrants | Haiti | 0.0 /100 | #309 | Tragic 84.7% |